How to make a Key Data Presentation – showing numbers and KPIs on a slide
Are you presenting some important data values on a slide? KPI numbers, company fact sheet, or sales campaign numbers?
Learn how to present numbers in a creative, strongly visual way, that will make your presentation outstanding.
We put together a bunch of slide designs for situations when you need to show a few critical values that should attract all eyes in the room :).
Elevate your business performance presentations with our curated resources – visit our financial performance PPT reports webpage.
How to creatively do a key data presentation
You can prepare a slide where you want to focus on a few important numbers and you don’t want to use standard charts.
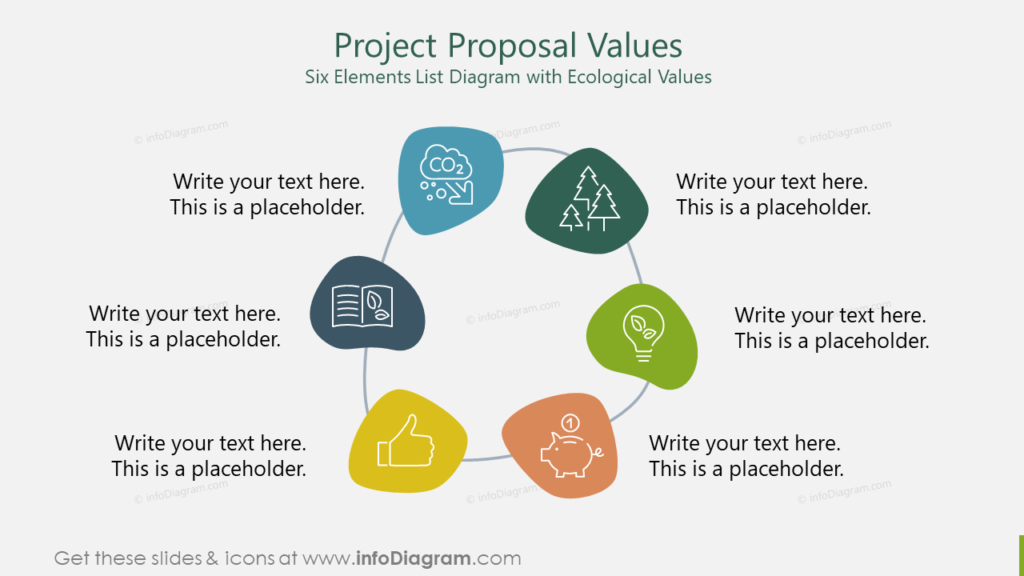
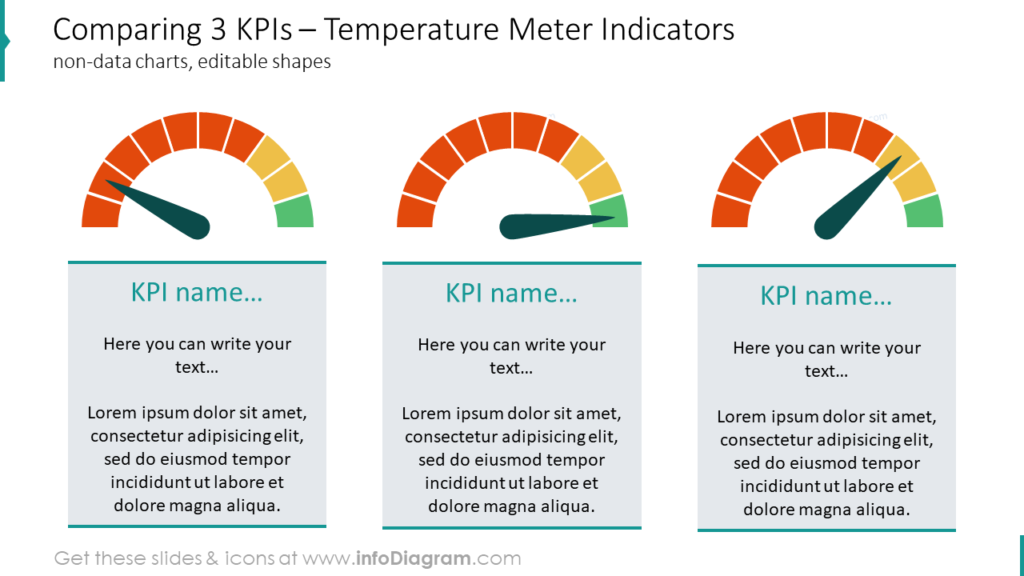
In such a case, try to use some simple PowerPoint infographic shapes. You can put there your three most important Key Process Indicators. Or basic information about your company (number of clients, employees, turnover…). Or extract your balanced scorecard measures.
We designed a set of flat-style diagrams and geometric shapes that can serve as perfect visual placeholders for your key numbers and a short explanation. All diagrams are PPT vector shapes, so they are fully customizable (colors, shape, outline, remove or duplicate items) in a few seconds. They require no artistic skills to adapt to your needs.
Use it as an inspiration for how you can present formal data in a unique visual way:
For more inspiration, subscribe to our YouTube channel:
Graphics we applied in this slide deck follows modern Metro UI graphical style (popular especially since MS Windows 8 used it). Those diagrams are easily redo-able in PowerPoint, Keynote or other presentation software.
Further reading on using diagrams instead of text slide:
This article is Part III of my series “Replacing Text Slide with Infographics”. See the other two parts:
- Replacing bullet points: Making Infographics Slides from a Text Bullet Point List
- Replacing timeline texts: Presenting Timelines using infographics diagrams
PS. What’s your challenge showing numbers? Comment below. I will be glad to give you some design ideas.