People Icons to Show Job, Company Roles, Customer Segments
If you need to illustrate a person’s company role, customer segment, or attitude in a presentation, then these people icons can help you.
This is an overview of visual symbols collection of various job positions and people’s emotions.
(get a full collection of People Roles PPT Icons here)
The people symbols can easily be added to PowerPoint or other office documents, including Word documents, web pages, or infographics.
4 reasons to use this icon set
When you need a specific people icon, Google search is usually the first option. However, there are some serious problems with using general pictures from the Internet:
- Unclear legal rights for using the icons from the Internet, e.g. author attribution is needed, or pictograms are only for non-commercial private use.
- It’s timely and not that easy to find specific people’s symbols (emotions, attitudes, or positions)
- The inconsistent look of images if you use several web resources
- Symbols may not be editable and they can be of lower visual quality (you know the effect of distorted edges – caused if you resize a bitmap icon?)
With our infoDiagram People Icons, we address all those issues. Check the example slides below (see details by clicking the pictures).
Where to apply people’s figures?
People’s figures will make any slide more compelling, you can use them for nearly every chart or diagram.
Here are some examples of how you can enhance PowerPoint presentations:
Illustrate organizational chart
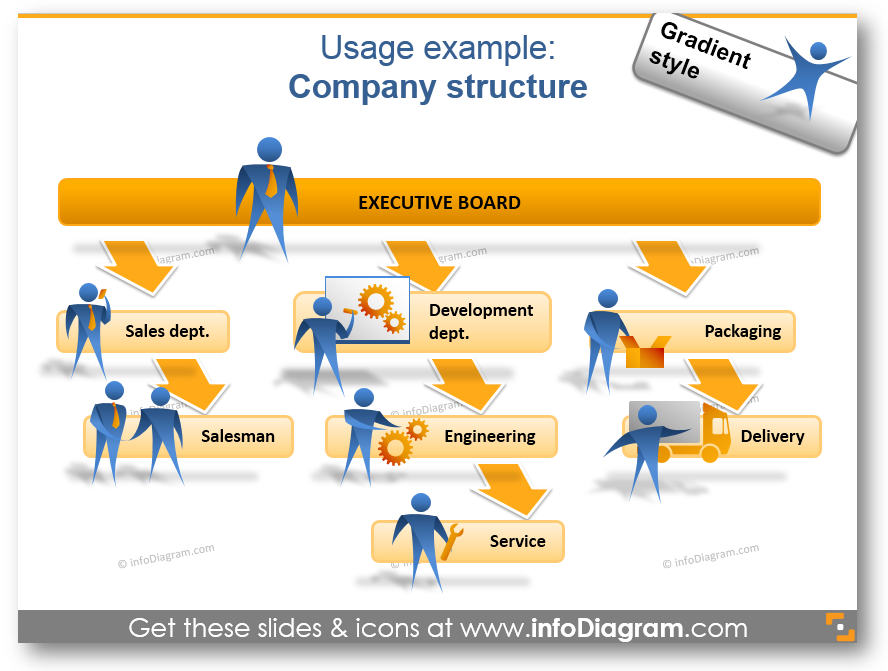
If you are about to make an HR presentation, then use catchy symbols for every position. That way you can turn charts into simple nice infographics.
Show structures and processes
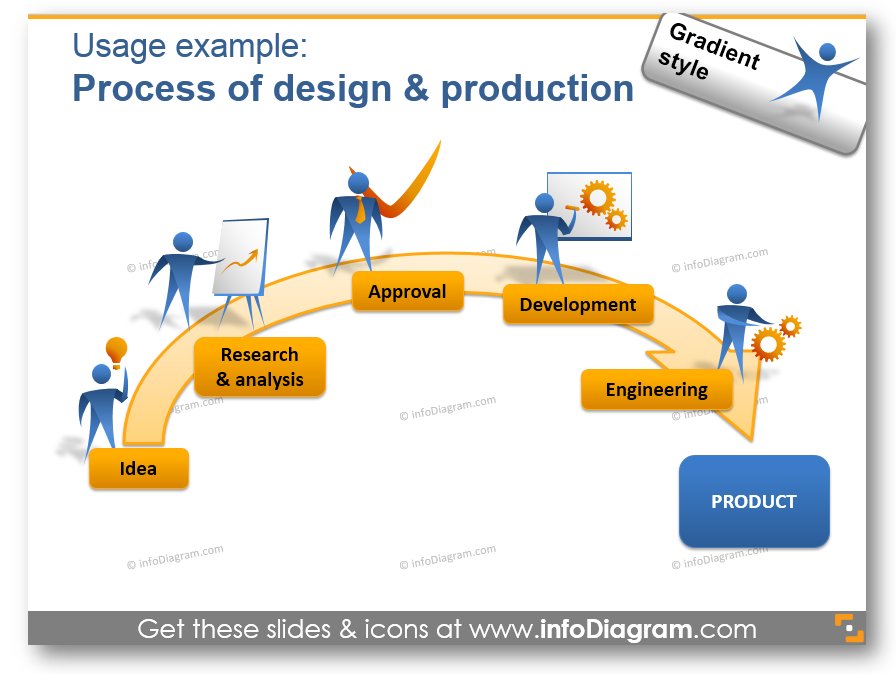
Like in the previous example, such diagrams are more understandable for the audience. In the picture, you can see the process of design and production. You can show any complex process with the help of such symbols in no time.
Present statistics and enrich data charts
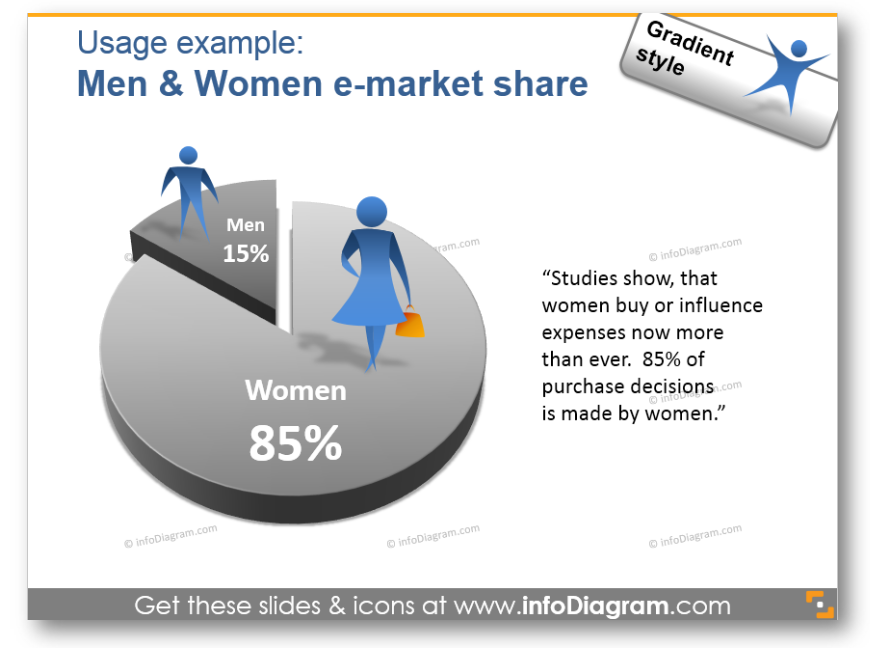
Need to show percentages or compare several products or projects? Pie charts are a great tool for that. Apply several people’s icons on it and it’s done.
Read more and see examples of how to redesign boring excel charts in a PowerPoint here.
Illustrate the problem-solving process
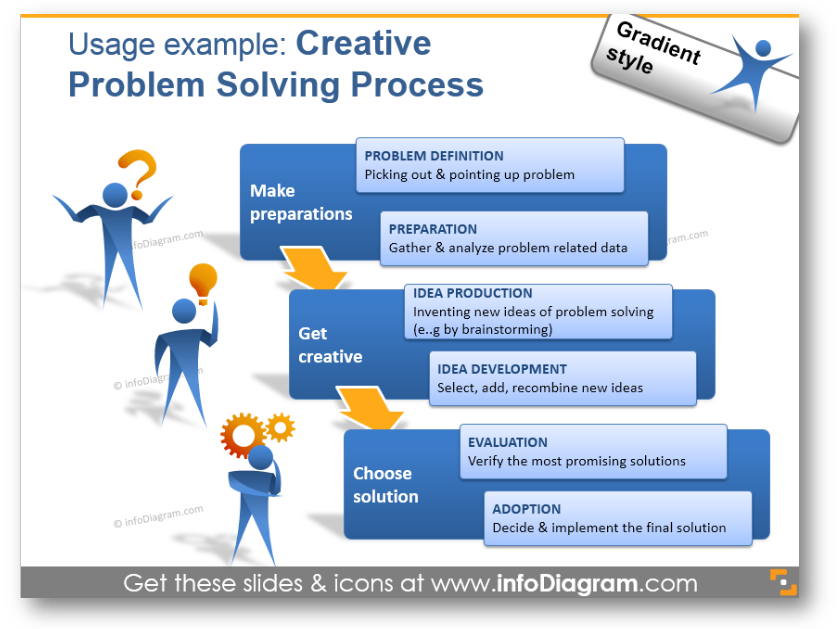
Another variant of diagram visualization. You can choose different symbols to illustrate people’s activities, as in the example.
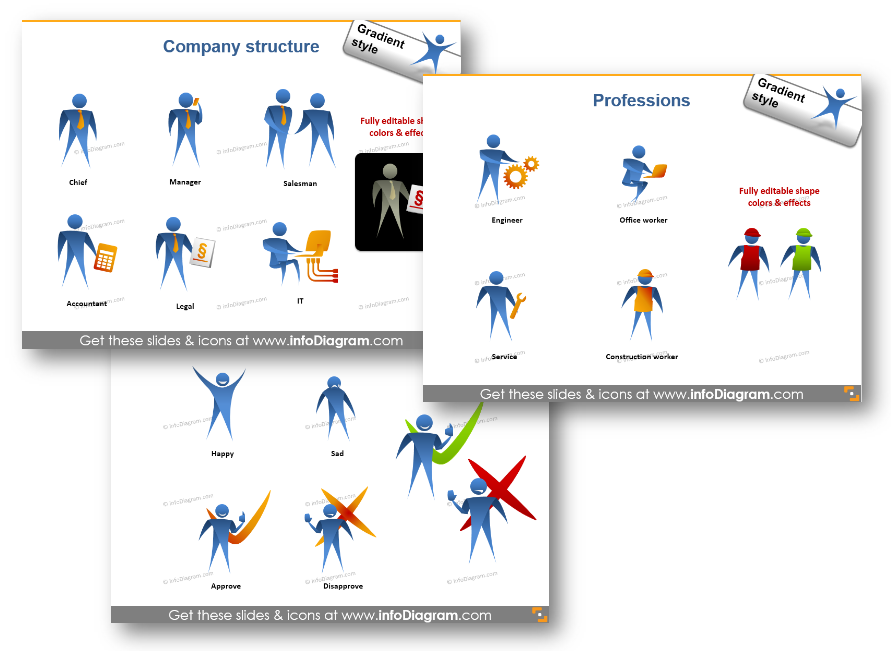
What’s inside the people icon set?
The collection contains various graphical elements for PowerPoint – 33 people gradient-style icons. You can choose colors to correspond with your brand or the color scheme and layout of your presentation.
The visuals collection consists of:
- Company structure roles: chief, CEO, manager, salesmen, accountant, legal, lawyer, IT analyst, marketing specialist, IT developer, designer, architect
- Jobs and professions: engineer, office worker, service, construction worker, doctor, pharmacist, packaging, delivery man
- Demographical customer segments: man, woman, child icon, teenager, youth, senior elders
- People’s emotions and attitudes: happy man, sad man, approving person, acceptance, disapproval, rejecting a person
- People activities and achievements: idea, creativity, puzzled, thinking, leader, winner icon, protection, shield, protecting person icon
- usage examples:
- organizational chart, typical company structure
- illustration design and production processes
- infographics of e-market share data chart
- creative problem-solving process
Check the details below:
All creative shapes and usage examples above are from our infoDiagram PowerPoint Diagrams collection. It contains picture shapes for enhancing PowerPoint presentations, which can be easily edited and added to your slides.
Besides adding these shapes to a PowerPoint slide, you can use them also in other documents – eBooks, Excel sheets, also Keynote, Prezi, and other tools. For MS Office apps a simple copy & paste of the data chart or symbols will work. For other tools (Canva, Prezi..) saving icons as image and adding them as a picture will do the work too.
Enjoy using our PPT visuals 🙂