Create Effective PPT Presentations with Modern Shutter and Circle Graphics
Are you sick of using lists in presentations? Do you wish you had a metaphor to use when describing synergy or completeness? Consider using shutter and circle graphics or segmented wheel charts.
A camera lens is a familiar object to most of us. Because it is so familiar it can be used as a base for many presentations and concepts without much additional explanation.
If you already have ideas for repetitive cycles or synergistic processes which could benefit from shutter graphics, click here to check out the full Shutter & Circle Segment Diagrams collection.
How can you use Shutter Graphics?
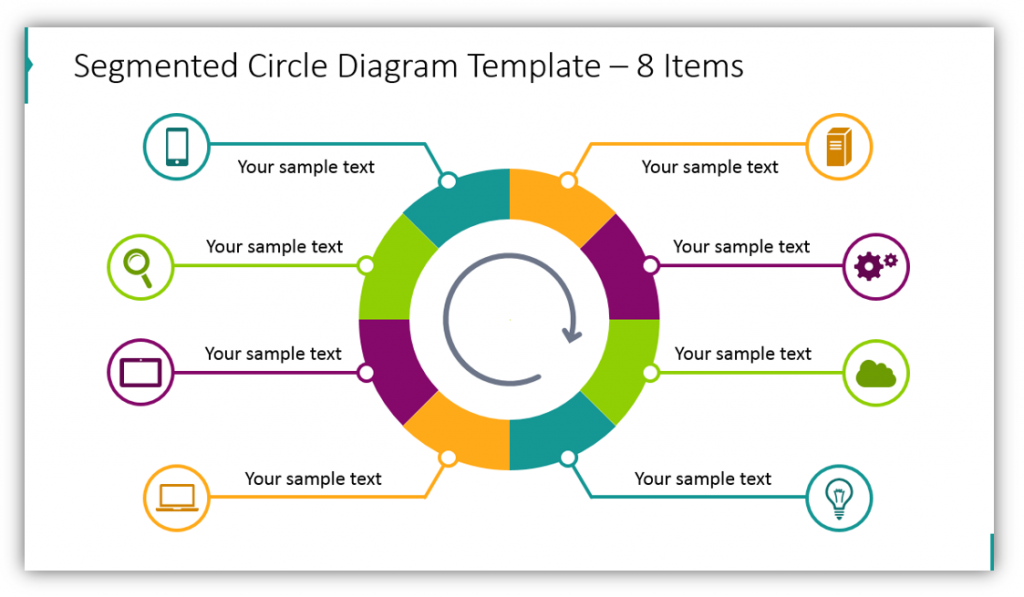
Use a Circle Fragments Diagram
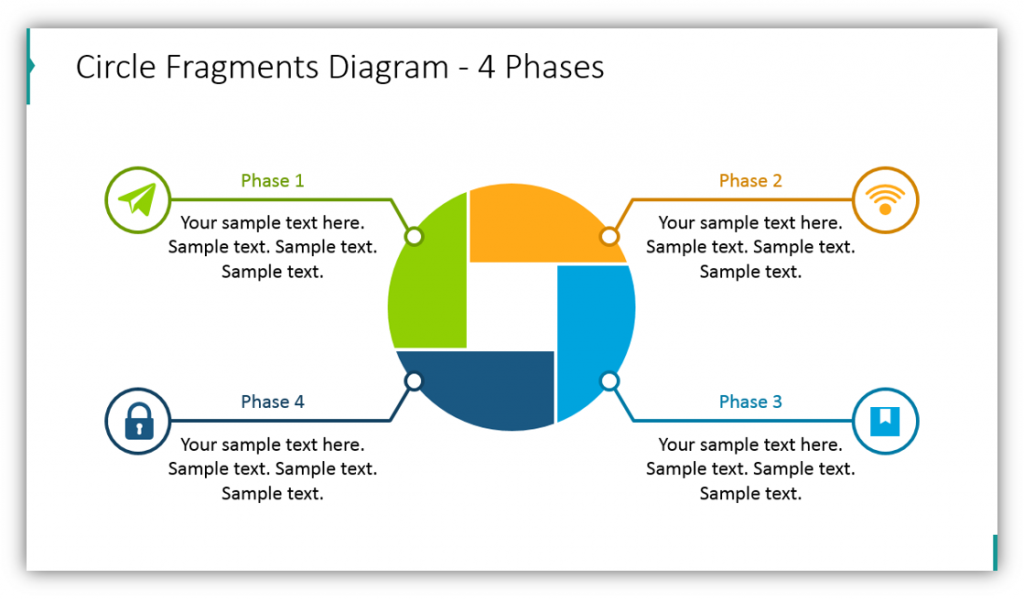
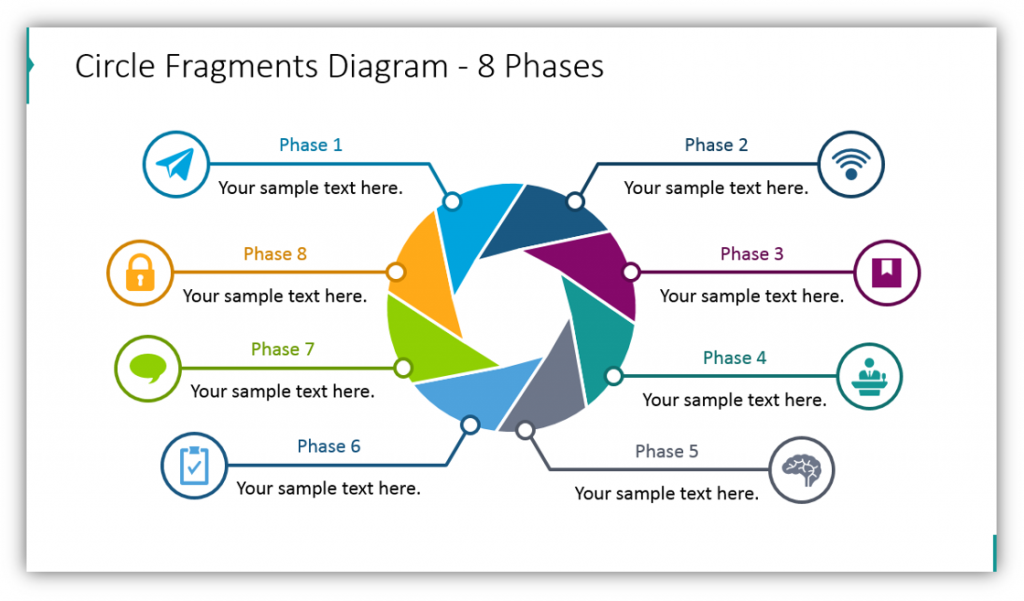
Do you have a process to explain which features multiple phases or stages? If so, this Circle Fragments Diagram could be perfect for you. You can easily customize each of the segments to a color which corresponds with the step itself or with your brand’s color scheme. Change the icon and title of each phase to suit your needs. Whether the cycle has four stages, eight, or a number in between, you can customize the look and feel of the slide.
Explain Phases with Three Steps with Simple Circle Fragments Diagrams
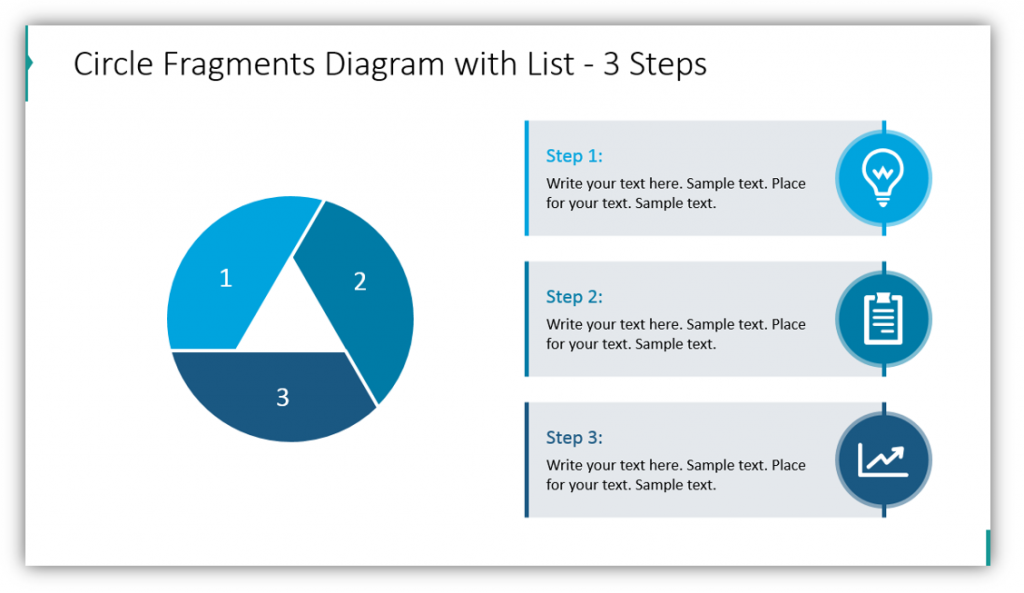
In this example, the circle fragments diagram only has three phases. Since there are only three steps, you’re given a larger area to add supplementary details and customize the graphic with small icons. The colors can be modified to match your subject matter, brand, or can be a visually striking color gradient like the example. It’s your choice!
List Steps With a Circle Fragment Diagrams
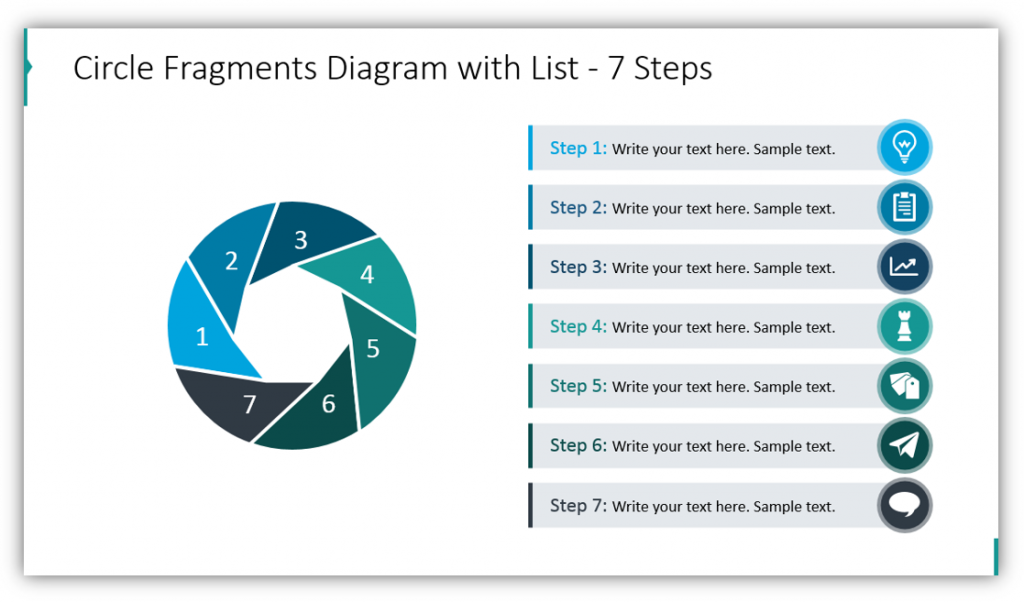
This visual metaphor is much more engaging and interesting than a simple text list with bullet points. Why would you use a block of text when you could help your audience stay interested with creative visuals? Provide context and additional supplemental information with the descriptive text boxes. Add additional information in the spoken portion of your presentation.
Use Segmented Circle or Shutter Circle Graphics to Explain Repeating Processes
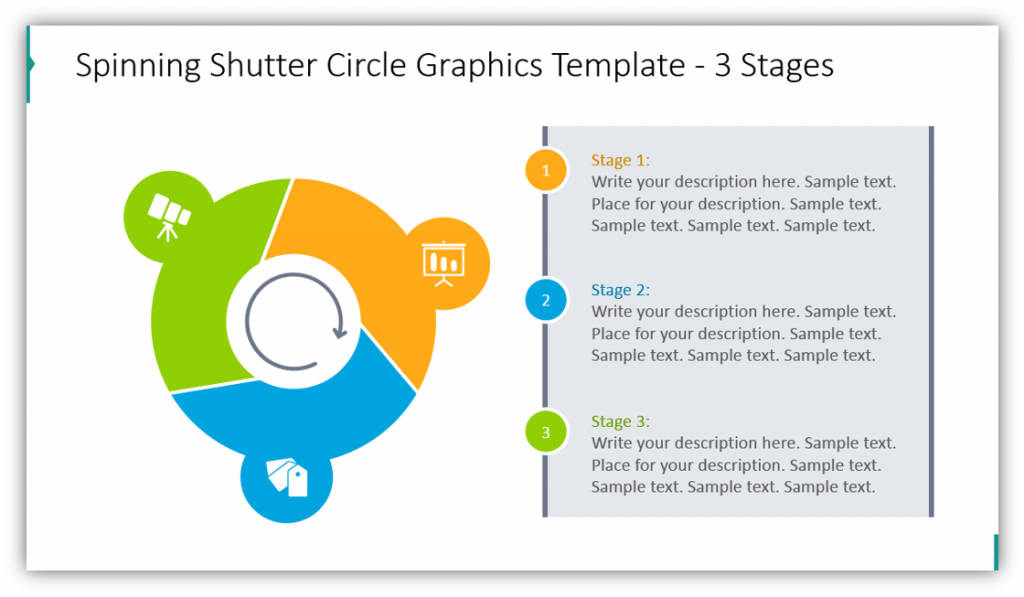
This development cycle is much easier to conceptualize. The arrow in the center of the circle accentuates the replicating nature of the process being presented. This slide makes use of the same colors, but could easily be modified so that each segment is a different color. You have the option to add details and icons to represent each stage or phase, so whether you’re explaining a technical process or the steps of product development, you can make the diagram your own. The second sample only features 3 stages, but the arrow in the center addresses the spinning of the shutter. This is a metaphor for the repetition of the cycle.
Use Camera Lens Illustrations with Sectors and Icons
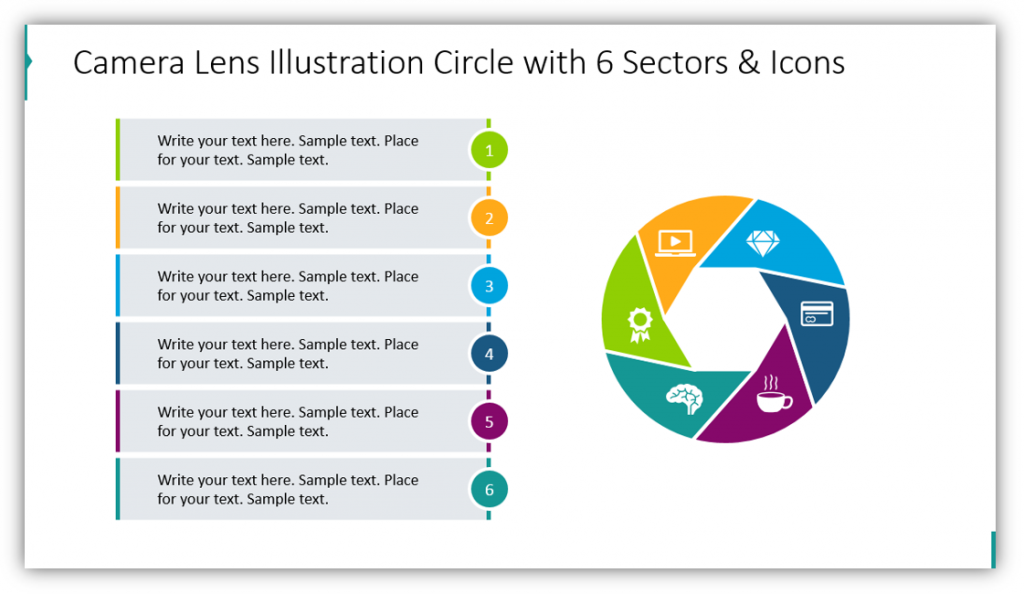
This six sector graphic is incredibly useful for breaking down a complex process. The icons, as well as the color-coding, help the audience understand what the cycle, concept, or process should look like. Add supplemental details in the text boxes, and be sure the small icons on the camera lens illustration matches what you’re using the graphic to describe.
Whether you choose to describe your synergistic process or concept with circle fragment diagrams, segmented circles, or camera shutter graphics your presentation is sure to be more interesting than one which only uses basic lists.
Resource: Shutter Graphic and Circle Segment Diagrams
Imagery can be helpful. Rather than shutting the brain down with mental overload, graphics can help take some of the mental load off. Now, instead of needing to visualize a cycle or process in addition to taking on all of the described steps, the cycle is laid out. This allows the audience to focus entirely on the new definitions, descriptions, and detailed information.
Did you find those examples useful? If so, you can check out the full slide deck here:
You can also download the infographics collection for more presentation graphics variety. Incorporate modern design diagrams to make your presentations come alive!


