Ways to Use Donut and Pie Chart Graphics
You are probably familiar with pie charts. Pie chart graphics are great for representing numerical values that comprise a whole. Pie charts are wonderful for when you need to show rough proportions of a few categories which total 100%.
What about the doughnut or donut charts? Those charts are basically pie charts with a hole in the middle. So they have a shape of a ring. The central part can be used to write there a key data value, category name, or illustration e.g. by a visual symbol.
Present Your Data in a Visually Appealing Way
Consider the data you need to present. Are you presenting market data in a table? Don’t overwhelm your audience by showing plain series of numbers. Visualize market shares by proper chart graphics.
Tired of presenting data in boring, overly complex, and confusing tables? Use concise, creative, simple graphics instead. See the full set of eye-catching donut and pie PPT charts here.
Compare markets with compelling visuals
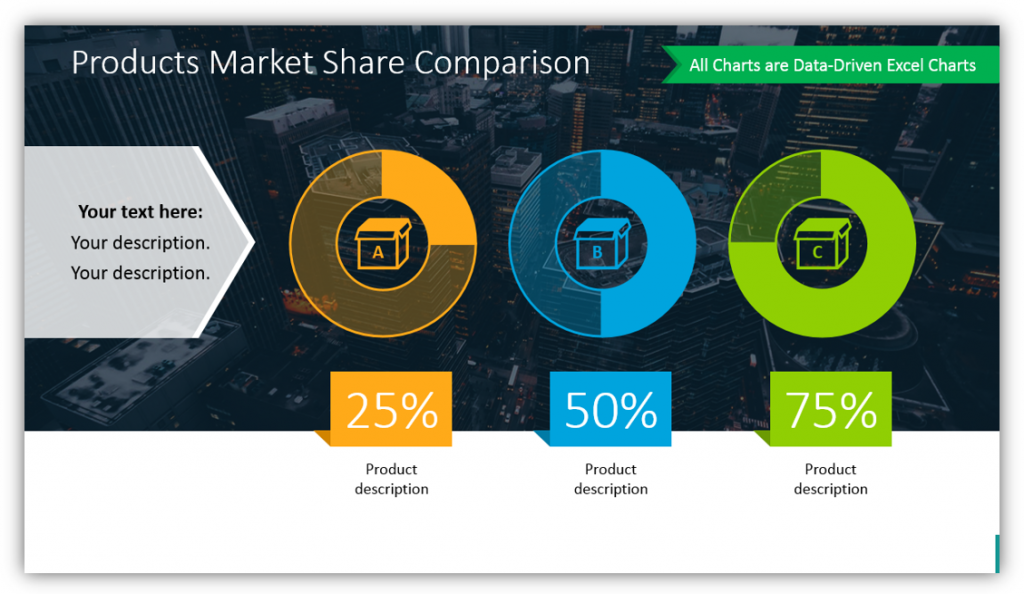
If you need to explain a market situation, you’ll make a more compelling presentation with intriguing visuals. As an example, if you needed to present your product market share, you may do so with several donut charts. In this example, the 100% market share is split across 3 donut charts which represent 3 different products. You could share how your products make up your share of the market.
Enrich Excel charts by some PPT graphics
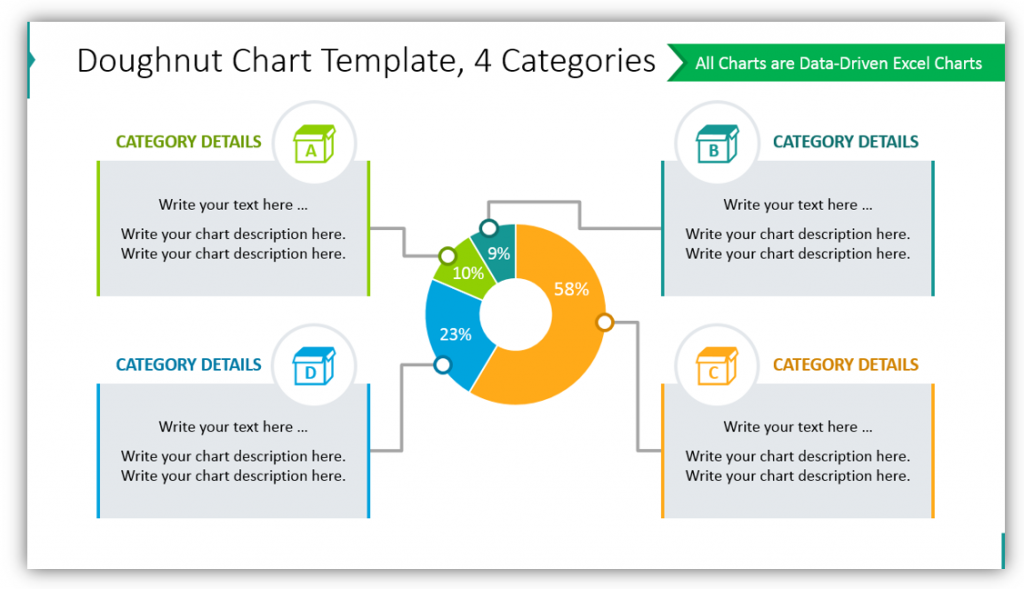
These charts are data-driven by Excel spreadsheets. However, by customizing the category details boxes with icons to represent what you’re presenting and providing descriptions, you can help your audience understand your message without providing wordy and complicated explanations.
Explain ratios or how you compare to your competition with donut charts
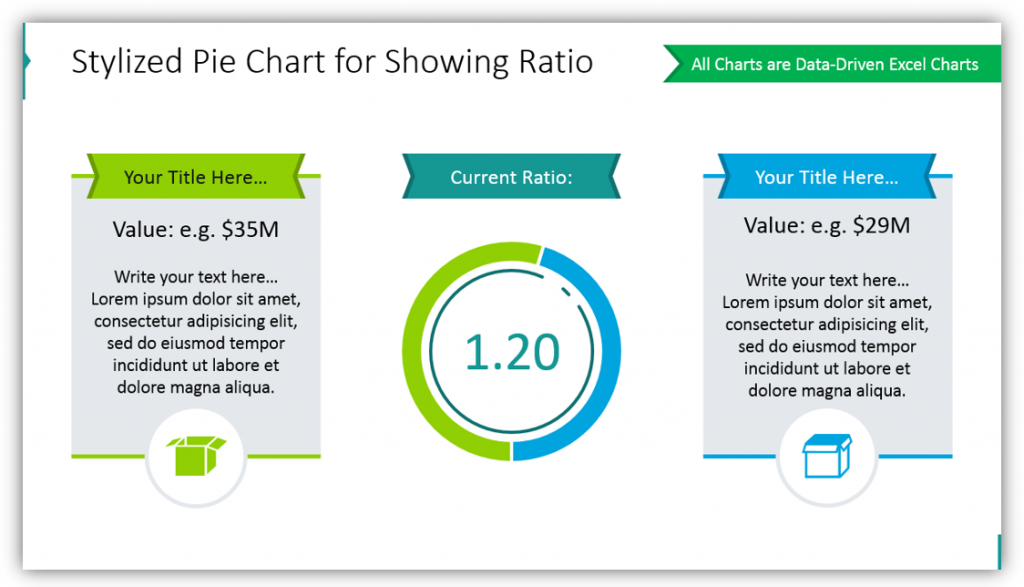
A donut chart showing two variables can be used to visualize a ratio among two factors. Adding a few light graphical elements will create an attractive data presentation, where you can write an additional explanation of your categories.
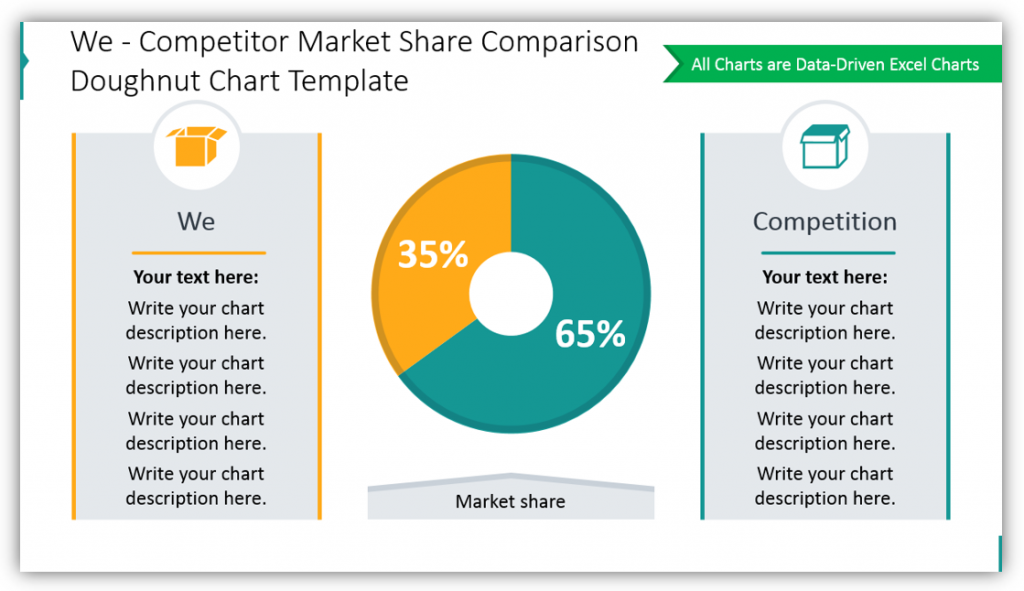
The figures and data you present don’t necessarily need to only be about your organization. You don’t need to exclusively present findings of your own company or organization. You can also present the information you’ve collected about your competition. If you have details about your competitors, you can share those details with your audience with simple yet interesting charts.
Resist repetitive graphics
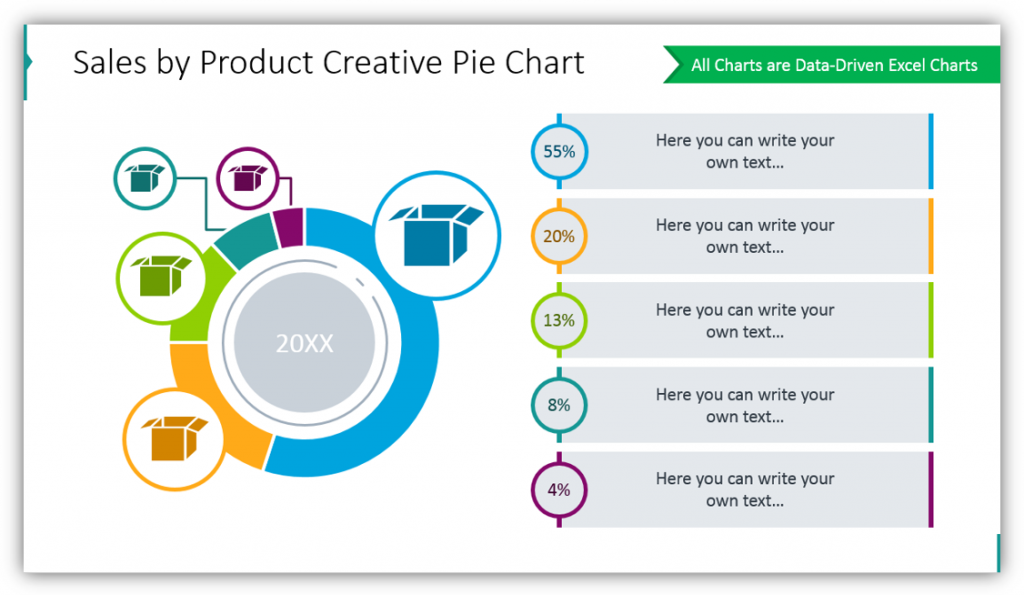
You can make the pie charts creative by adding accents and details. By adding icons to represent each of the categories, you can help your audience put your ideas together and make sense of your message. The sample chart is beautiful and easy to follow. If further customizations were added, additional text and unique icons would drive the message home for an audience.
Making Chart Legend Nicer
With a little effort, you can replace the default data chart legend with a nicer one, adding a few icons and place for longer text.
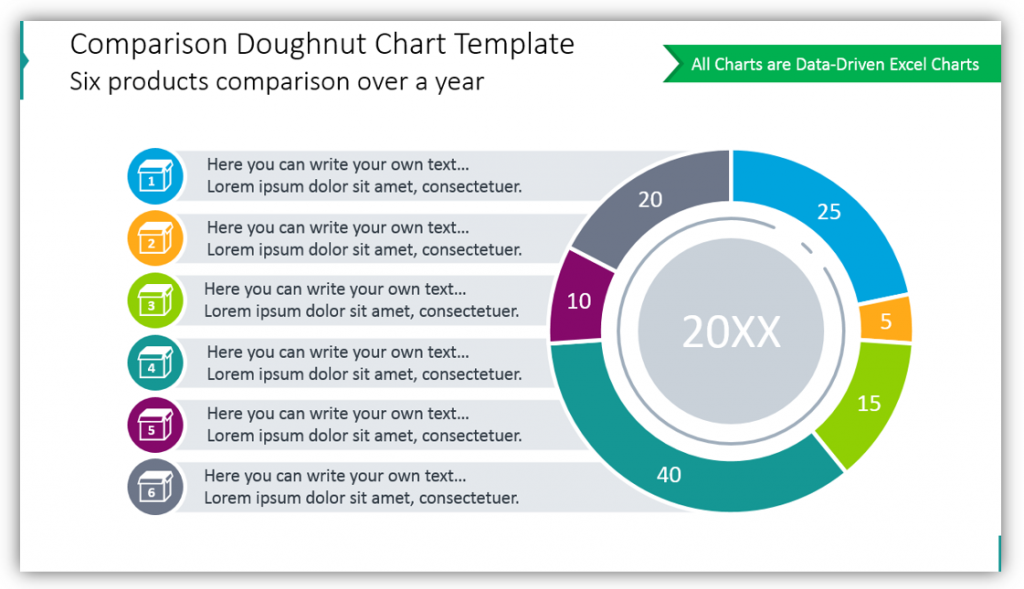
This example shows how you might compare 6 different products over the course of a year. How do they compare to one another? How do they combine to make up the full year’s market share? You may explain these things and more, as well as provide additional details about each category or product of your choosing.
Present abstract concepts through compelling visuals that share your full ideas in an easy-to-follow manner. Resist using repetitive graphics and customize the ones you do utilize for maximum impact.
Resource: Donuts and Pie Charts Data-driven Graphics
Create a professional, cohesive presentation with a donut and pie chart. Take a look at the full collection:
Don’t rely on standard charts and tables offered by Excel or PowerPoint default. Utilize striking imagery instead. Put your ideas together in easy-to-follow, interesting ways.


