7 Slide Layout Ideas to Illustrate Omnichannel Strategy and Metrics
Do you need to present your omnichannel strategy? If you’re looking for a way to increase the understanding of your tactics and action plans, see our visualization ideas in this blog. Check examples illustrating this business model, success elements, and action plans. Take your presentation to the next level!
Explore our Business Performance PPT Reports category on the website for more resources to boost your presentation impact.
We hope our slides will help you stop wasting time on figuring out how to present this retail or another strategy and allow you to transfer all our ideas to the presentation.
All slide examples below can be downloaded as an editable source. See the full Omnichannel Retail Strategy Presentation graphics for PowerPoint.
What is Omnichannel Retail?
Omni-channel retail (or omnichannel commerce) can be defined as a multichannel approach to sales that focuses on providing a seamless customer experience whether the client is shopping online from a mobile device, a laptop, or in a brick-and-mortar store.
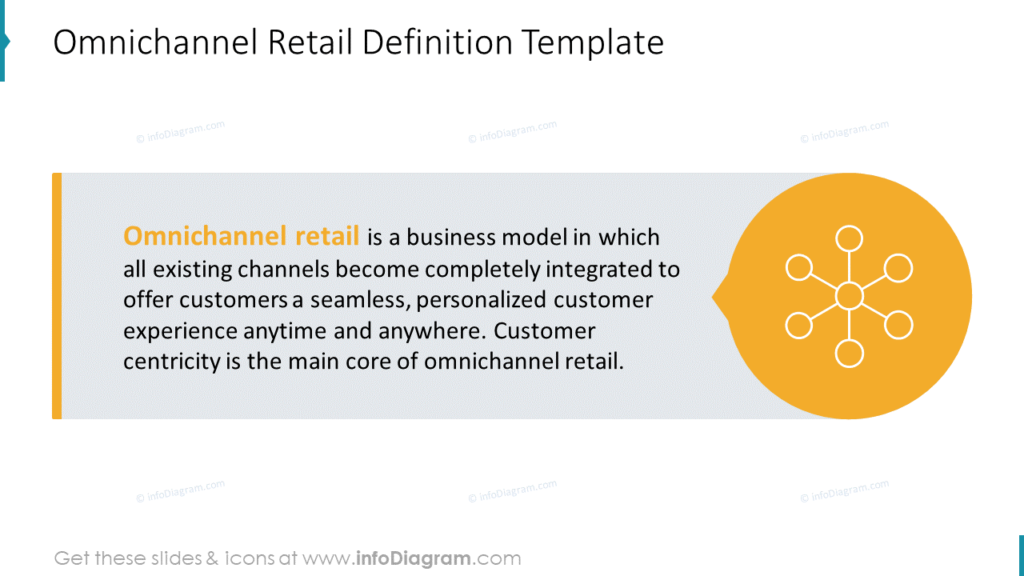
You can visually show the definition like on the slide above. Adding these design elements such as a grey text background and a visual symbol will make the slide more appealing.
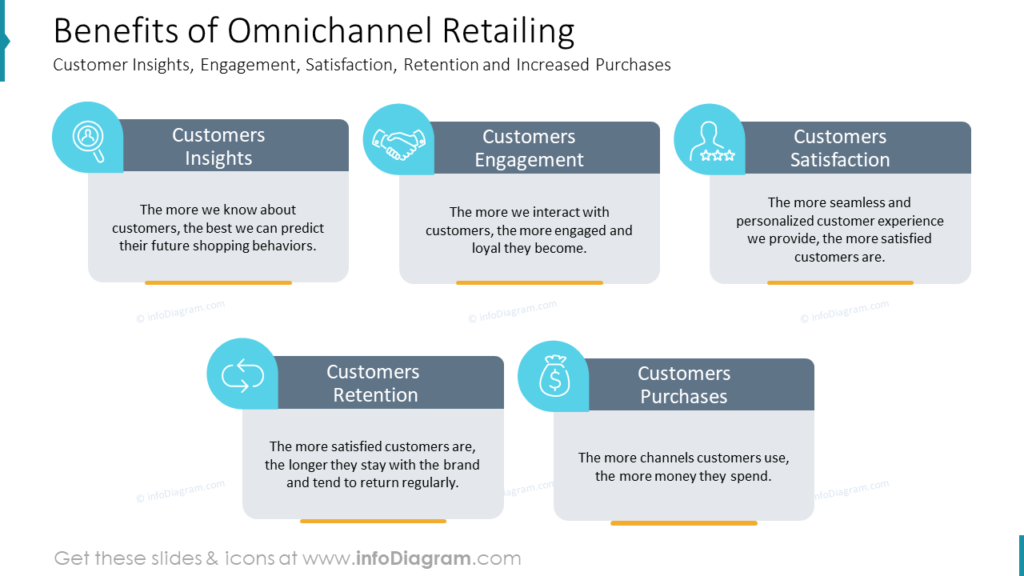
List predominant benefits of omnichannel retailing
The benefits for your organization can include Customer Insights, Engagement, Satisfaction, Retention, and Increased Purchases. It’s better to present such a list not as a set of bullets, but in a more graphical way. For example, we created 5 boxes with a place for description and illustrated each benefit with an icon.
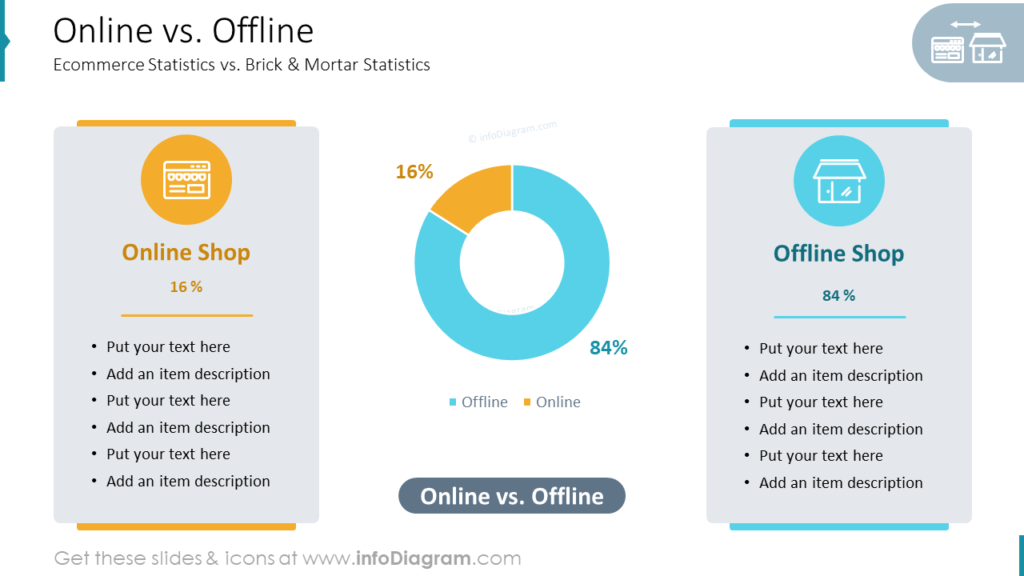
Present comparison of online and offline environment
Want to show an action plan for connecting your online and offline business environment? Don’t list only raw numbers, rather use a pie chart, which is always great for illustrating statistics, and columns with a description for e-commerce vs. brick & mortar statistics aside.
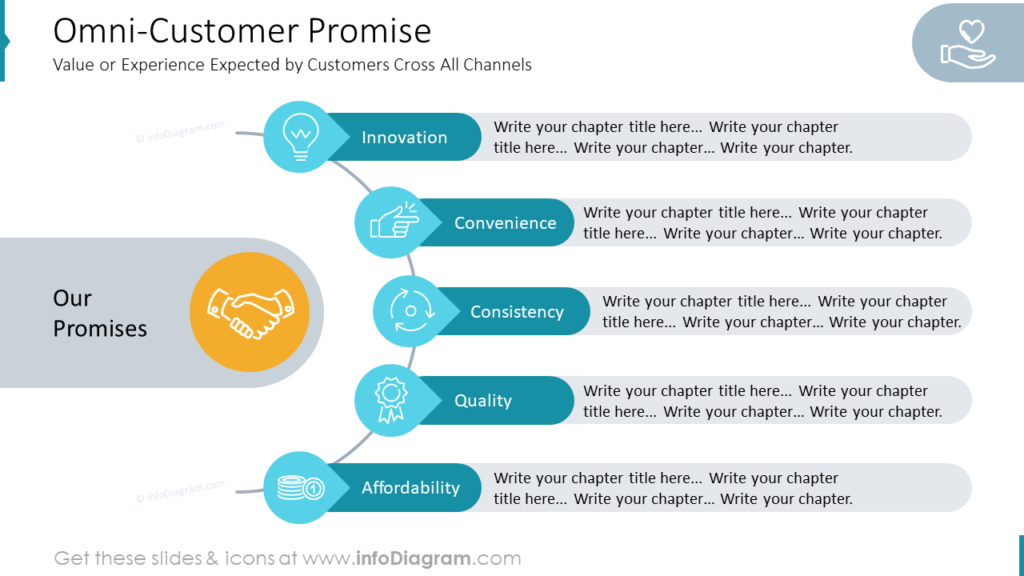
Illustrate your omni-customer promise
If you want to show that a value or experience expected by customers includes several areas, you can use a visual diagram instead of a plain bullet point list. The omni-customer promise can include the following points: Innovation, Innovation, Consistency, Quality, Affordability. You can also apply icons to give the slide the professional design touch.
Design your omni-customer journey slide
The process of the omni-customer journey usually contains some form of those phases: Awareness, Consideration, Decision, Retention, and Advocacy. To present this process, you can use a metaphor of a curvy path.
However, due to the complexity of the curvy shape of roadmaps and journeys, such slides may be hard to create.
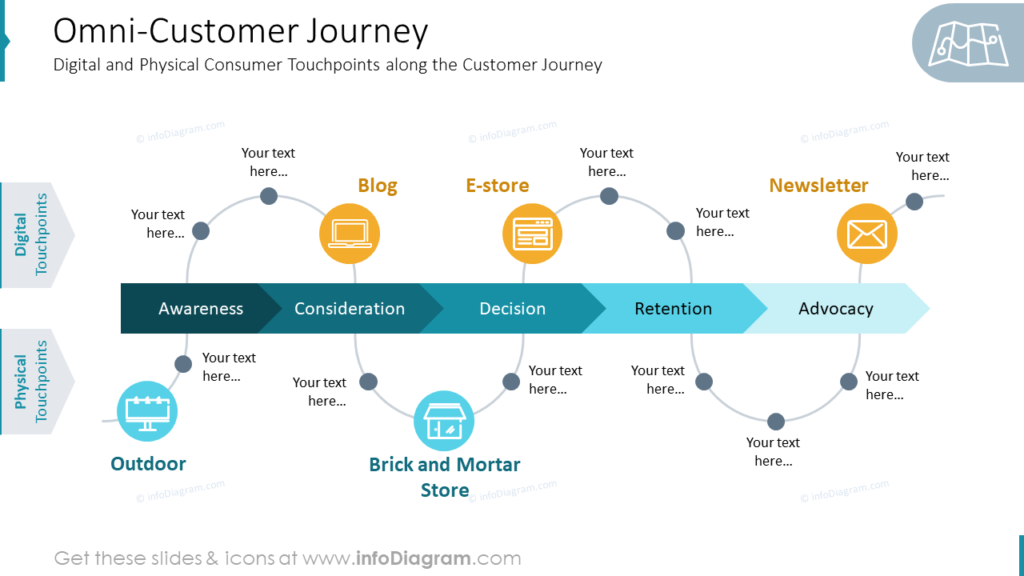
If you want to include every step of the journey, you can reuse such a template: in the center, there is an arrow with all stages, digital consumer touchpoints are above, and physical ones are below it. We included some of the most common steps on the slide and illustrated them with modern outline symbols.
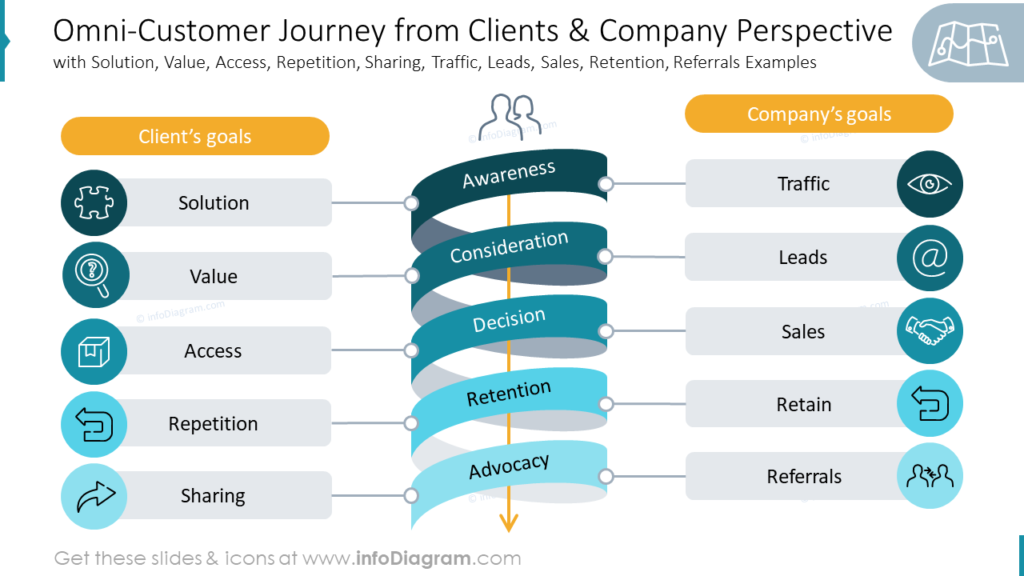
To show the omni-customer journey from both clients & company perspectives, you can use such a creative spiral diagram. The goals may include Solution, Value, Access, Repetition, Sharing, Traffic, Leads, Sales, Retention, and Referrals Examples.
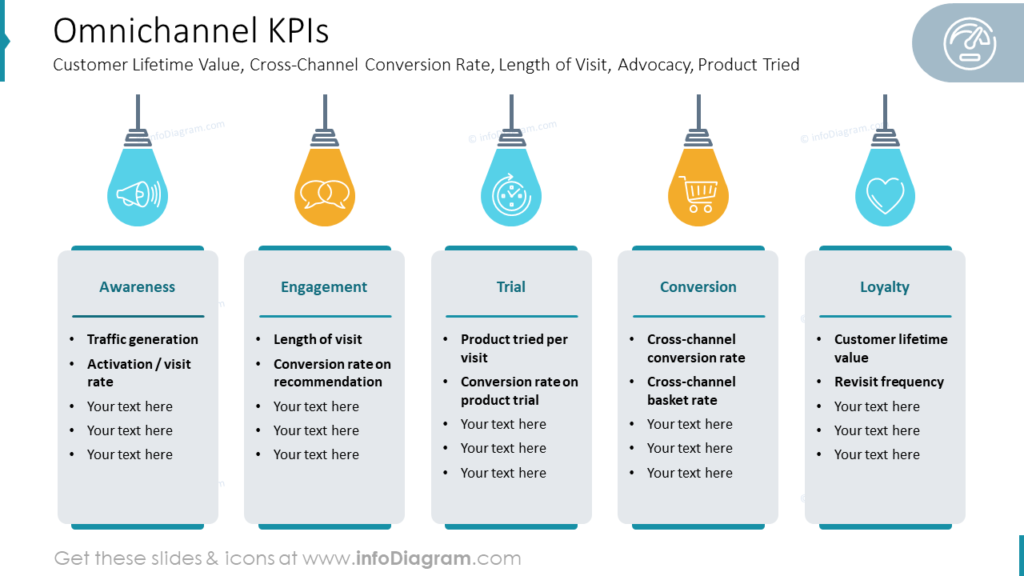
Describe the omnichannel retailing KPIs
Such a slide can be used to present omnichannel retailing KPIs which are in your organization. In each company they will differ, the most common are Awareness, Engagement, Trial, Conversion, and Loyalty.
In our slide example, we also placed icons in the light bulbs above the columns to make the design more attractive and associative.
Show omnichannel analytics relevant to your company
There are several ways to represent the analytics visually, which will help you avoid standard bullet points. See our slide example below.
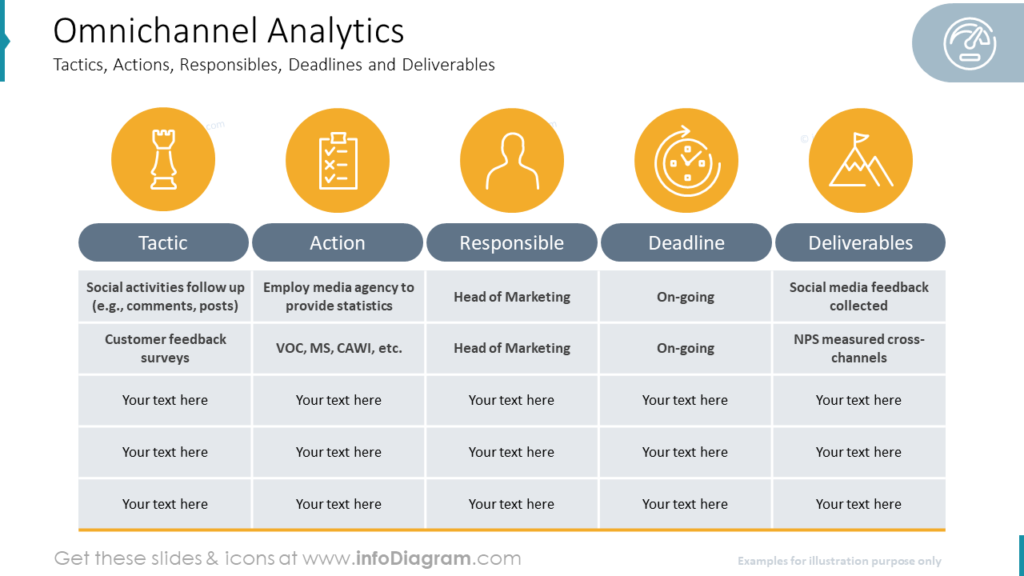
The first template you can use is such a table, with five following indexes: Tactics, Actions, Responsibilities, Deadlines, and Deliverables. Each column is dedicated to one of them, so there’s enough place for text description.
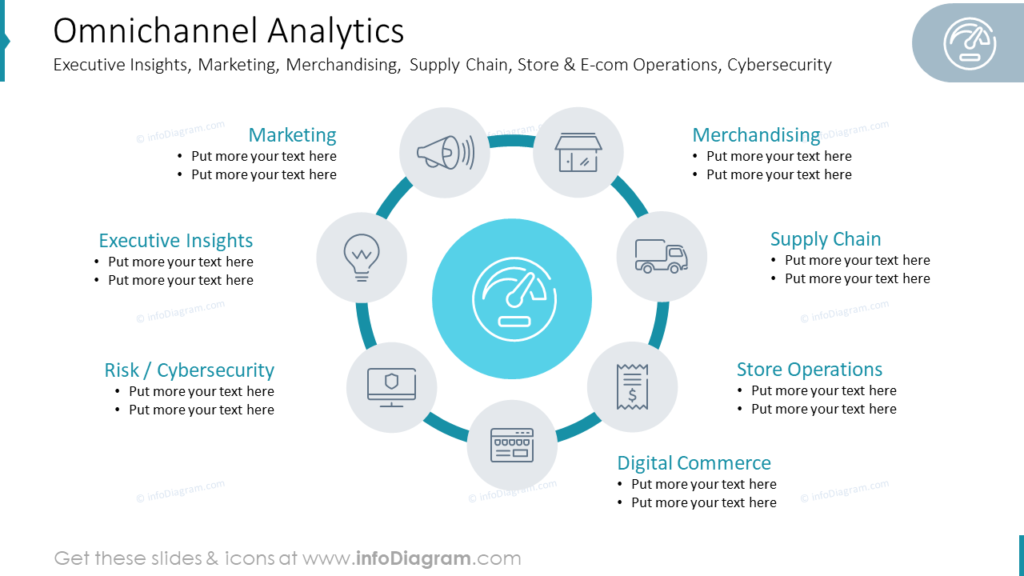
Such a circle diagram is another option you can use. With its help, you can not only show the analytical part of your strategy but also the importance of data integration from all existing channels. We listed the common indexes, such as Executive Insights, Marketing, Merchandising, Supply Chain, Store & E-com Operations, and Cybersecurity.
For more inspiration, subscribe to our YouTube channel:
Resource: Omnichannel Strategy Retail Presentation
To help you out with presenting omnichannel strategy we have designed a PowerPoint template with diagrams and icons for presenting your tactics and action plans.
You can get a PowerPoint deck with editable graphics here:
If you are looking for more diagrams to include in your presentations, consider the ultimate collection of modern outline-style diagrams.