
How to Effectively Present Country Market Insights in PowerPoint
When you want to present a market analysis of a specific country, using…
Presentation visual ideas for marketing professionals – from market analysis, sales avatars, CSR, media planning, customer journey, and experience analysis to various survey reports.
When you want to present a market analysis of a specific country, using…

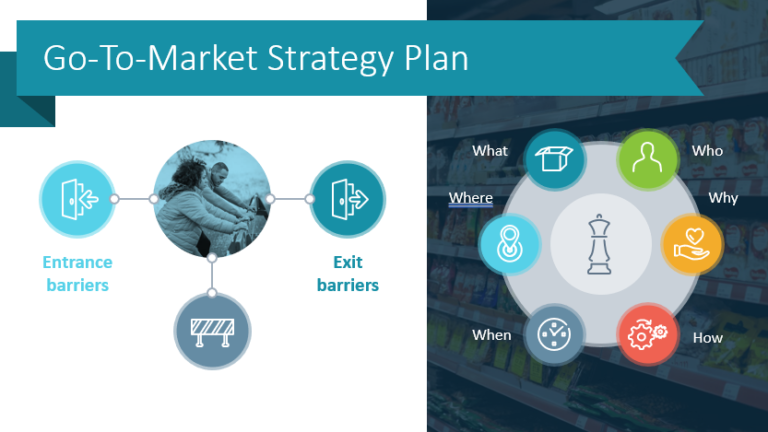
Are you planning business growth for the start of the year? Need a…
Do you want to showcase a B2B segmentation in a visually compelling way?…
Do you need to present a segmentation of some kind? For example a…

Operational marketing incorporates various processes and topics you may need to coordinate and…

For a company looking to sell a food or nutrition product, what you…
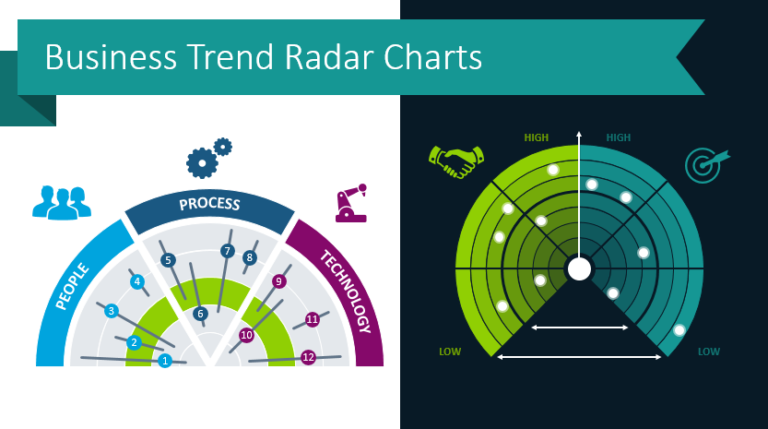
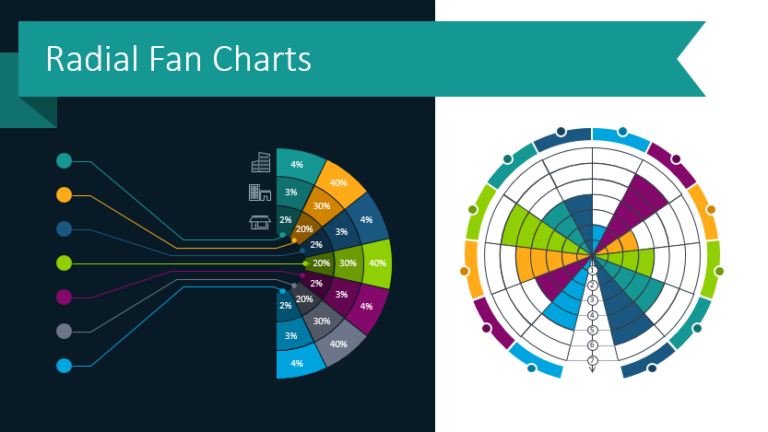
How to present your market trends and landscapes of new technologies in a…
Do you struggle to make your informative presentations interesting and engaging? If you…