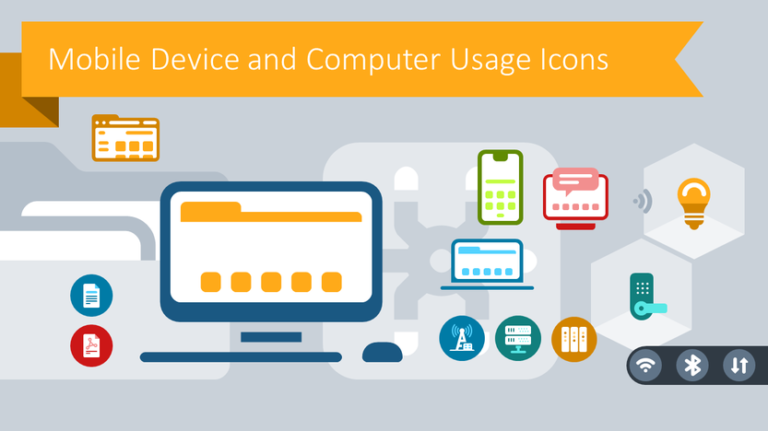
Creative Mobile Device and Computer Icons for Better Presentations
Mobile device and computer usage presentations don’t have to be boring. Whether you’re…
Slide design ideas for information technology and AI presentations. You can find here examples of Digital Transformation infographics, DevOps processes, Agile, Scrum, and other IT project management approaches. We added also ideas for explaining AI, ChatGPT, Data Analytics, Data Privacy and GDPR, Data Science, and Web Analytics.
Mobile device and computer usage presentations don’t have to be boring. Whether you’re…
Basic presentations on computer and telecom topics are always risky. If your audience…
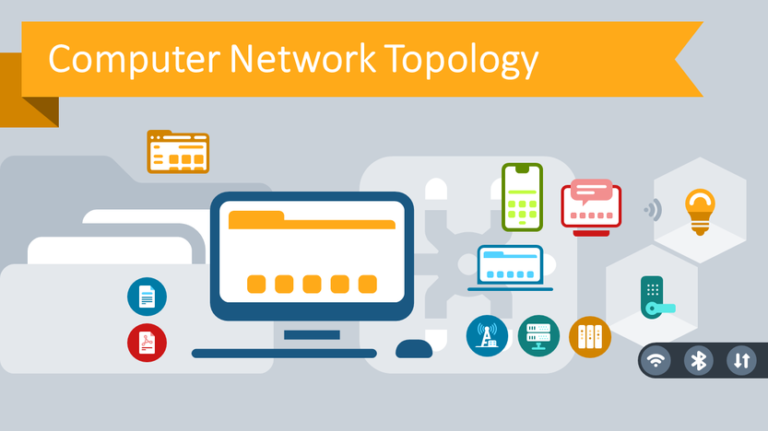
Do you need to give a presentation on technical IT concepts such as…
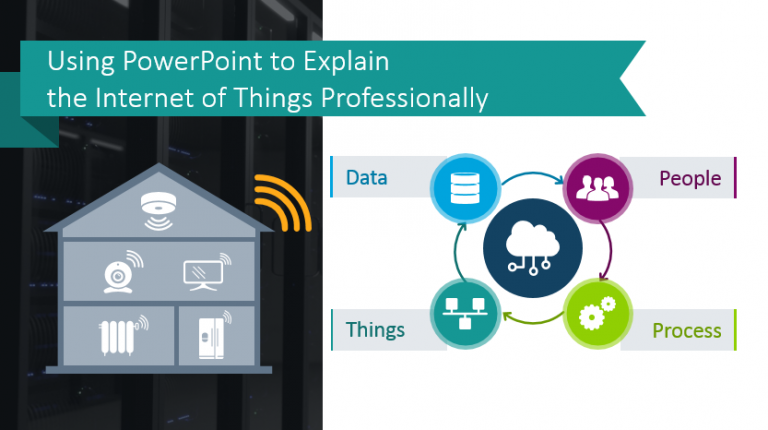
The Internet of Things is the extension of internet connectivity to physical devices.…
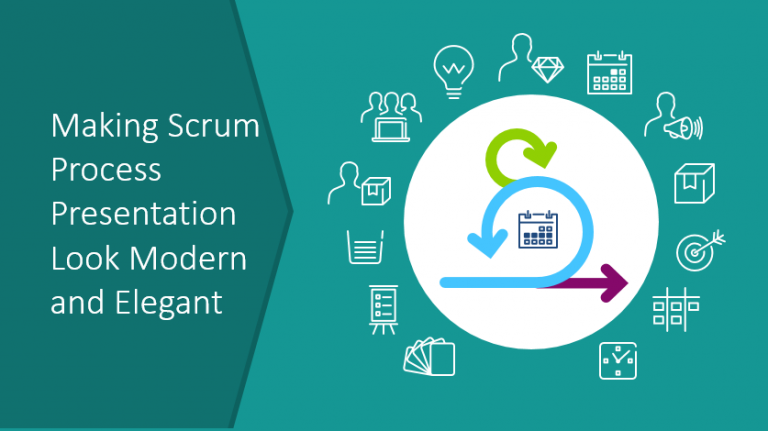
Do you need to explain your Scrum methodology and process to new hires,…
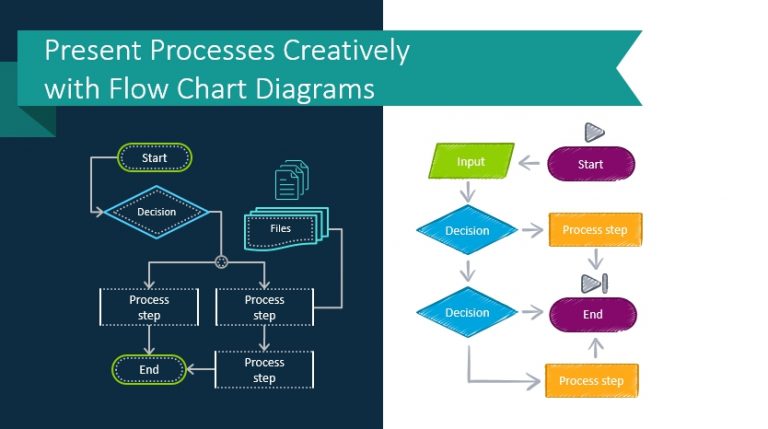
Presenting processes and algorithms is tough. Getting your audience to understand your message…
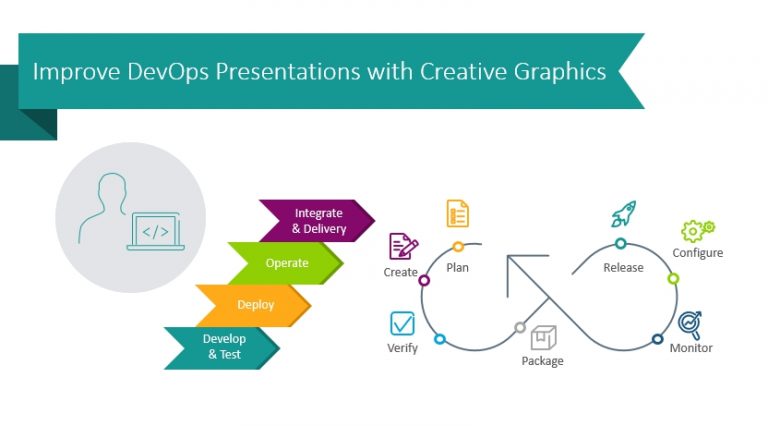
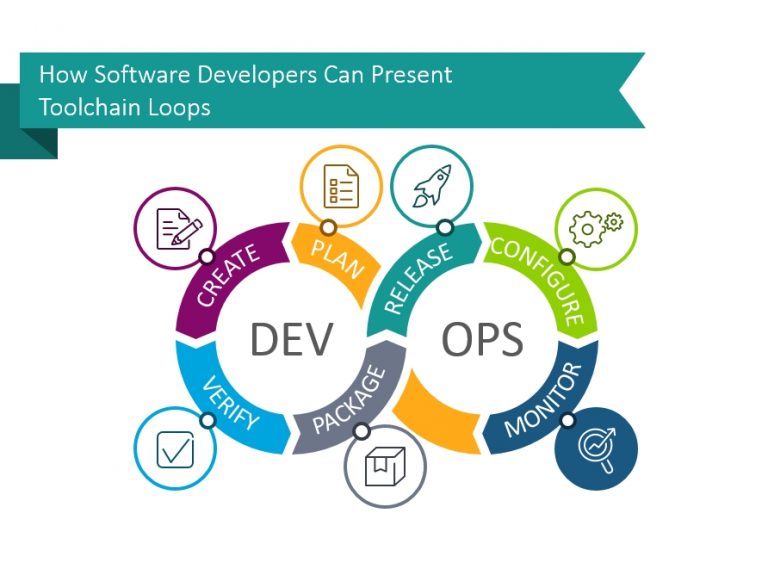
Explaining DevOps methodology concepts and processes can be challenging without the appropriate tools.…
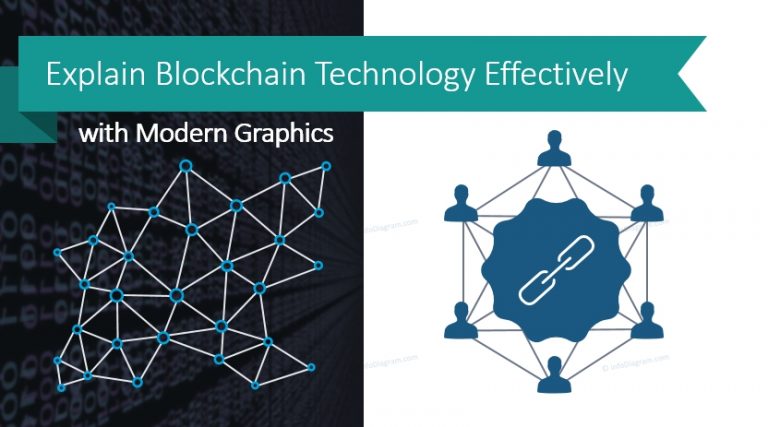
Defining concepts like distributed ledger, block structure, benefits and the applications of blockchain…
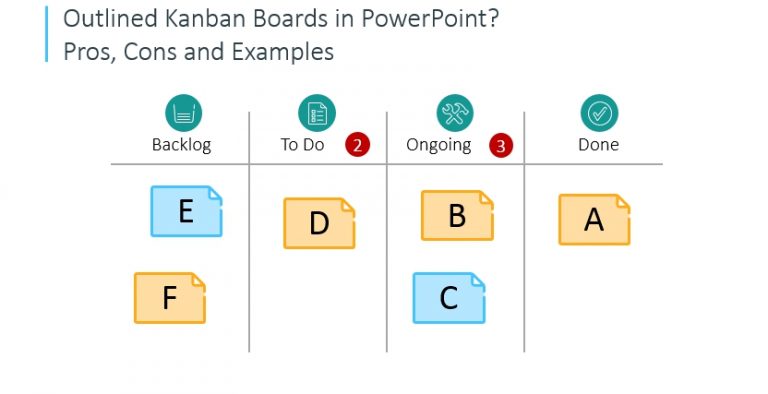
The essence of the Kanban approach to agile project management lies in using…
When working in software development management, you may need to present the frameworks…