BCG Matrix Definition and Examples [presentation infographics]

The Boston Consulting Group’s product portfolio matrix (BCG) is designed to help with long-term strategic planning, to help a business consider growth opportunities by reviewing its portfolio of products to decide where to invest, discontinue, or develop products. Since 1968, the BCG matrix, also known as the Boston or growth-share matrix, has been a tool to answer those questions by providing them with a way to analyze product lines in search of growth opportunities.

Continue reading BCG Matrix Definition and Examples [presentation infographics]

Porter’s Five Forces Diagram Infographics Presentation

Do you want to visualize your strategy’s potential on the slide? In this blog, we presented creative graphics that can help you illustrate the position of a business organization with PowerPoint.

Continue reading Porter’s Five Forces Diagram Infographics Presentation

Illustrating Strategy in a Presentation [concept visualization]

A strategy is a common topic I often see in company presentations of all kind. Typically those are business plans, board presentations or investor pitches. The strategy defines general actions over the course of several years. The challenge is how to quickly and neatly make a strategy illustration in your document? What image to choose?

Continue reading Illustrating Strategy in a Presentation [concept visualization]

Planning Your Year with Slide Calendars Graphics

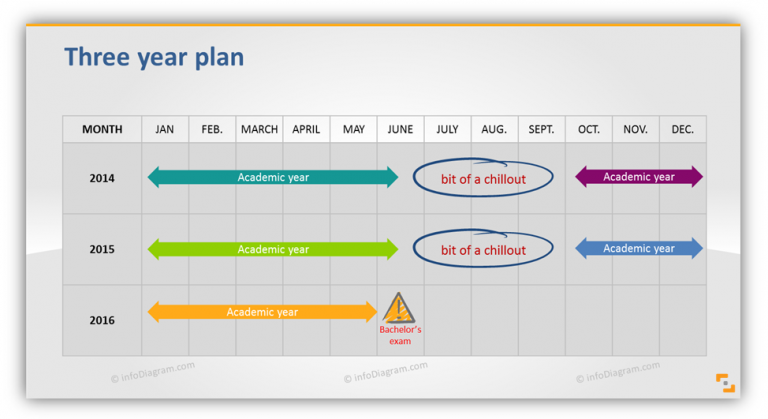
Remember your student times? It’s been over a decade for me, but I still recall this wonderful period of my life.
Nowadays students have a pretty busy schedule. Besides classes, exams, projects, they are often involved in part-time work. Thus, keeping focus, planning, and managing time is a crucial new skill they want to handle.

Continue reading Planning Your Year with Slide Calendars Graphics

How to make attractive Annual Company Review presentation

As the end of the year is approaching, you may be involved in preparing an annual company review presentation. Here’re some simple tips on how to make it visually attractive. How to make financial results more interesting, inspirations for showing sales, production, accounting data, and other KPIs in eye-catching visual form.

Continue reading How to make attractive Annual Company Review presentation