
7 Ways to Make PowerPoint Tables More Attractive and Clear in 2024
Are you tired of presentations full of cluttered tables? We know how frustrating…
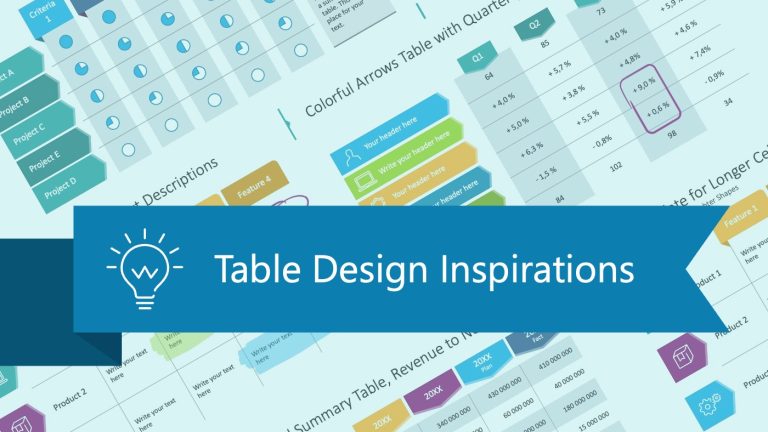
Desing examples how to present PowerPoint tables with numerical or text data in a graphical form.
Are you tired of presentations full of cluttered tables? We know how frustrating…

Are you tired of the same boring-looking tables in your presentations? When you’re…

Are you preparing infographic tables for your presentation? Do you need to show…

Tables can help you present your information or data effectively. If you want…

It’s this time of the year… Time to make plans! If you’re about…
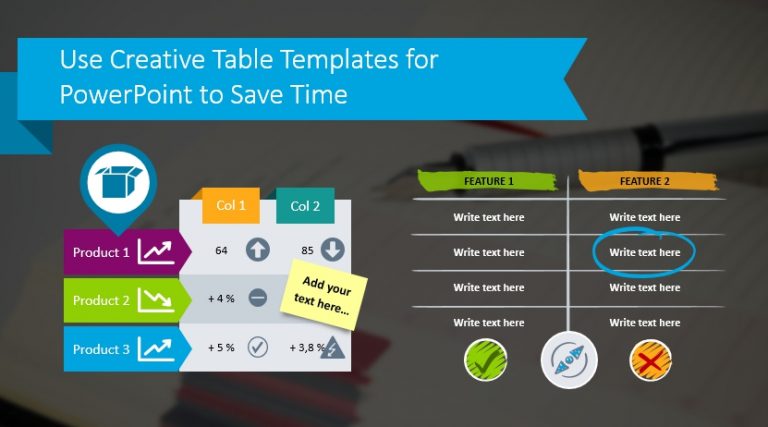
When making data-heavy presentations or sharing dense information, you may wish to use…
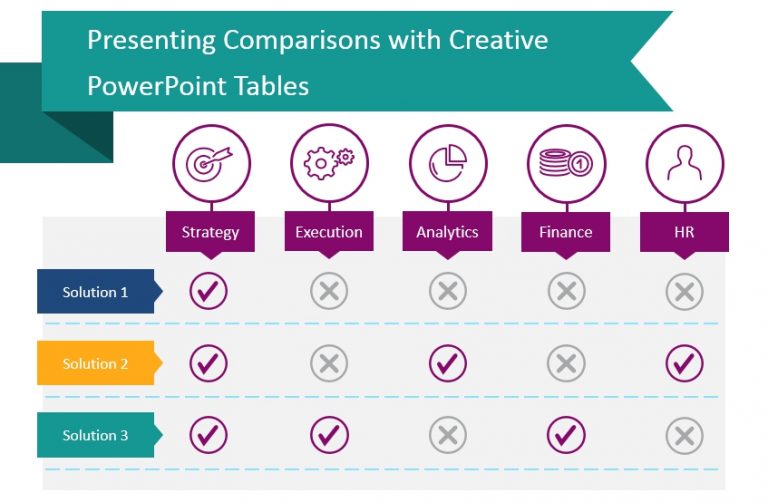
Comparing complex product features or purchasing decision alternatives can be challenging, especially when…
Tables are used everywhere in business – price lists, KPI comparisons, project meetings,…