How to create infographics in PowerPoint – part I
Surely you have seen many great infographics. Want to create your own? Never did it before?
First thing, do not be overwhelmed by graphics made by professional designers. Everyone was there where you are now. I suggest making your first infographics with PowerPoint. This guide will help you get started. So cheer up and let’s start.
But I do not have data
I also wonder where these folks get the data for infographics. The best way is to search for similar infographics and check their sources. The infographics zone is a great place to start. Google images will do the job as well.
The most important thing at this stage – limit your research time. This is where you will lose most time and eventually get discouraged. I recommend from 30 to 60 minutes. You need to find 4 to 5 stats like:
- data series to show a trend
- percentage values for the pie chart
- numeric values for simple bar charts (3-5 categories)
Size and format of a slide
You are probably used to a slide size you see by default when you start PowerPoint, either it is 4:3 or 16:9. However, you can use any slide size in PowerPoint. Infographics use the “skyscraper” format. Height should be about 3 times the width:
 |
| How to re-size a slide in PowerPoint |
Here is a screencast on how to resize the slide: how to create infographics in PowerPoint.
Background
Next, let’s set a background for your infographics. Here is the easy way to do it. Select color and then add texture with transparency (watch below steps in the how-to screencast) :
-
- Go to master slide view.
- Draw a rectangle covering a whole slide.
- Set the color of the rectangle to RGB: 231, 226, 208
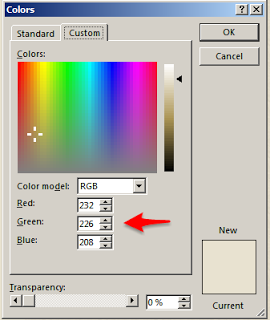 |
| Setting custom color of PowerPoint shape |
-
- Duplicate the rectangle (Ctrl-D)
- Fill the new rectangle with texture “Paper bag”
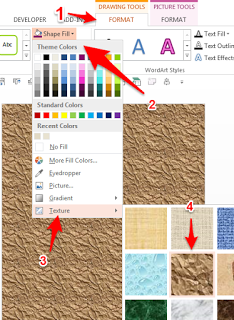 |
| How to fill PowerPoint shape with texture |
-
- Set transparency of texture to 93%.
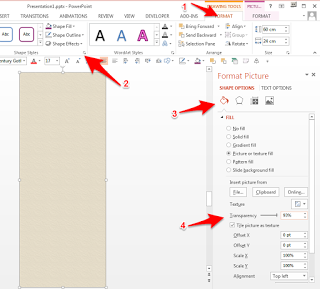 |
| How to set transparent background of the shape in PowerPoint |
You should end with this such effect.
In part II I will show you how to create headers, clean charts and data callouts to make an appealing infographic.
Watch this video tutorial for complete step by step tutorial, but be warned that it takes 22 minutes :):

