Use Flat Paintbrush Stroke Diagrams to Build Creative PPT Presentations
Do you wish you could present the listed information in an interesting way? Even if you are not a designer, nowadays the possibilities are endless. There are many creative ways to replace dense text blocks. We created the paintbrush stroke graphics set to help you give presentations a creative flair.
What are Paintbrush Stroke Graphics for?
You can easily use paintbrush stroke graphics to represent a timeline of events or a process with many steps.
If you want to make your data and graphs look more creative, check out the Flat Paint Brush Strokes PPT Graphic set.
1. Create colorful columns with paint strokes
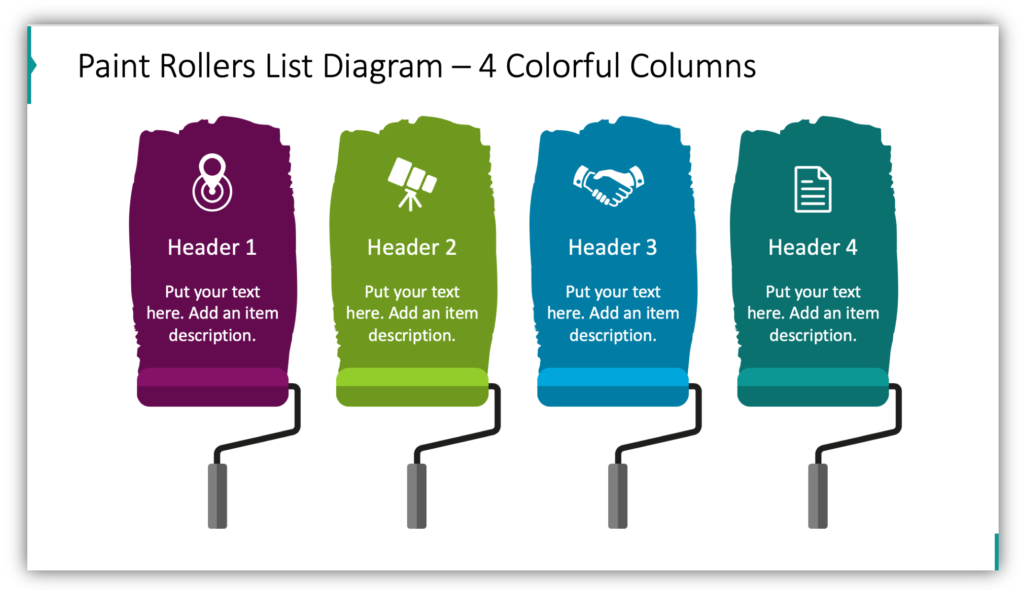
Tables containing text or data are not visually striking. Neither are text-heavy, dense slides of information. In the example, you see how 4 paint strokes with rollers at the bottom can be used instead. This slid is more likely to be recalled by the audience after the fact. Why? Because it is more visually appealing. You can customize each paint stroke with icons, as we have done in the example, as well as text. This will help you provide more contextual support for your presentation.
2. Use paint strokes to represent rows
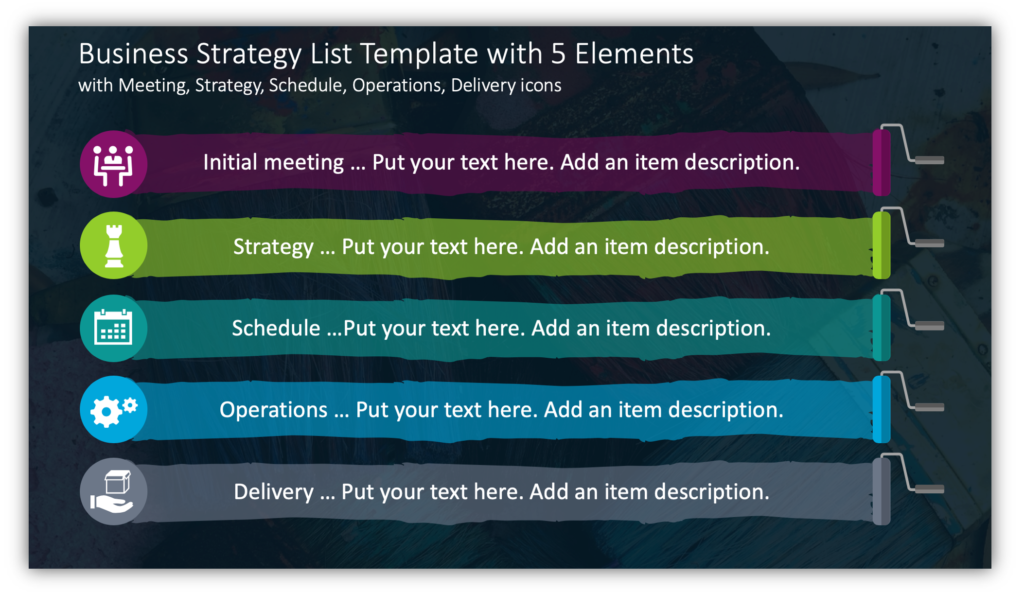
When you use paint strokes horizontally to replace rows in a table or bulleted list, you can effectively present a process. Break the process down into steps. Icons can help explain each step and provide a visual reminder as you progress through your explanation.
3. Paint strokes make better bar graphs
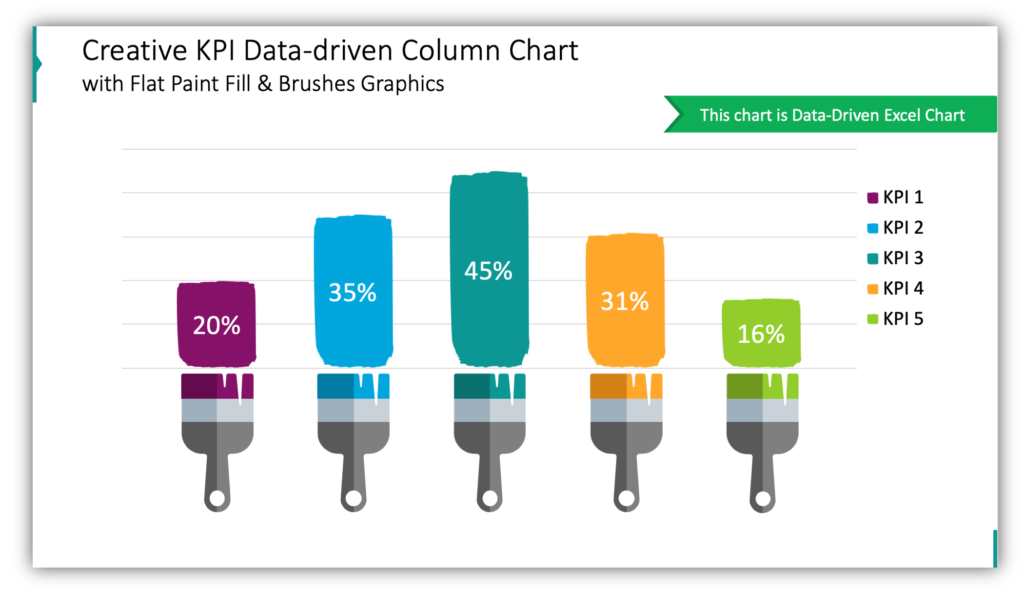
There are many ways to customize bar graphs and make them interesting. Using the flat paintbrush stroke diagram set you can use data from your Excel sheets to make a stunning, creative visual. Don’t settle for dull, default Excel charts when you can instill creativity in your presentations.
4. Use flat paintbrush stroke graphics as progress indicators
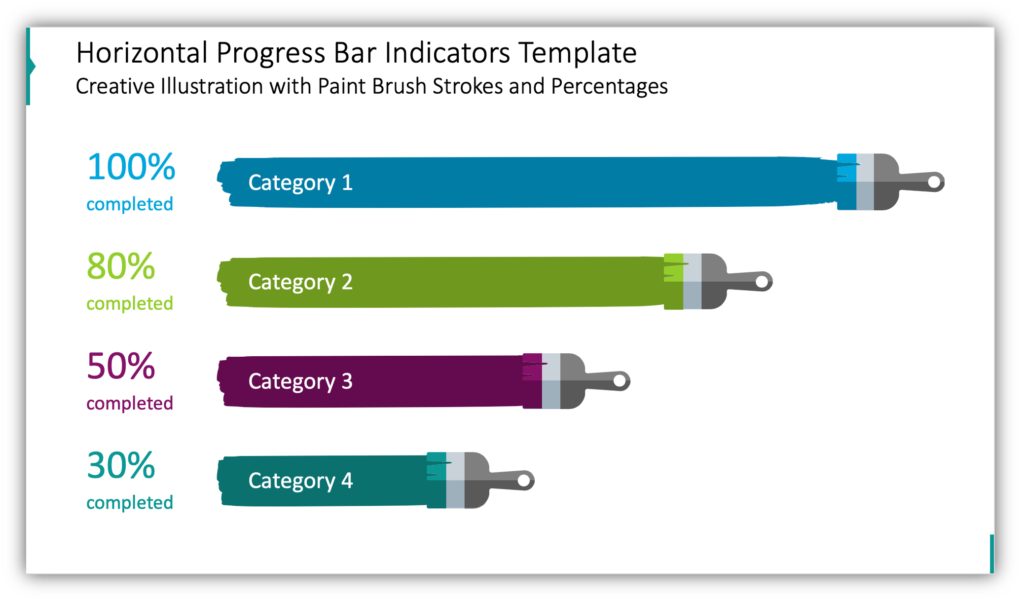
Even if you don’t have an Excel sheet, you can use brush stroke diagrams to represent the completion of a project or phase of a project. These visuals are clever alternatives to a boring, default pie chart!
5. Present a matrix with multiple elements
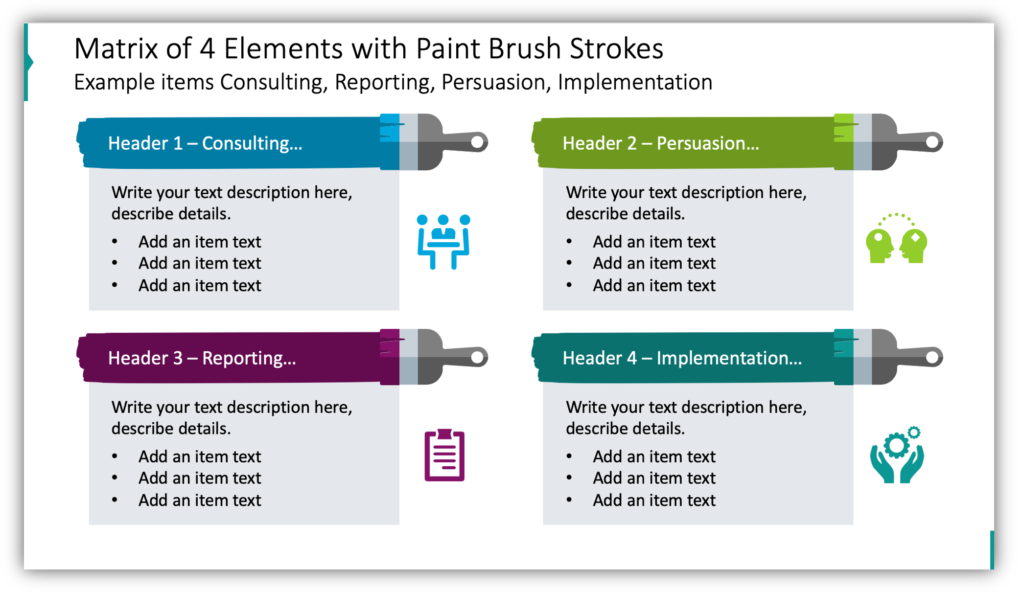
Do you need to present a matrix with several elements? Use paintbrush strokes to create headings for boxes. Use the boxes to provide additional details and descriptions for each element. Customize each paint stroke with a color that represents each element, and match that color to the icons you select.
Paint stroke diagrams are versatile and creative
When you need to add an artistic flair to your visuals, paintbrush and paint stroke graphics are a simple but effective option. Whether you need to discuss business strategy, describe a process or project, or share information that would otherwise be presented in a bulleted list or table.
Resource: Flat Paintbrush Stroke Diagrams
Elegant visuals help you make your points more effectively by giving your audience something eye-catching to focus on. Avoid using the same old, same old graphics by branching out with this modern, inventive alternative. Shift away from tables and into graphics. Articulate your points more clearly and concisely with paint brush stroke graphics:
Want more ideas for how you can customize slides? Click here to see our biggest diagram collection.


