12 Financial Presentation Templates for PowerPoint [2026]
Browse 12 PowerPoint templates for financial presentations - from annual reports to investor decks. Professional slide designs for revenue, P&L, and budget data.
Financial presentations usually contain dense series of numeric information, that makes it hard for the audience to stay focused. The way you present the content is essential in this case. People will follow your presentation only if they are not lost and can clearly understand the meaning behind those numbers.
Visual aids can help you make your presentations more pleasing to the eye and professional-looking by using graphics. With that in mind, have a look at the following PowerPoint templates. They can be inspiration for you how to illustrate topics like investment risks, company performance, annual budget planning, and more.
Get any of the decks below – click on the pictures to see and download the presentation. See more in our Finance and Business Performance PowerPoint Templates collection.
Recommended PowerPoint Templates for Uplifting Financial Presentations
These twelve decks will help you create high-quality financial presentations and illustrate various finance-related topics visually:
- Financial report and performance indicators
- Listed Company Financial Report
- Half-Year Sales Report
- CapEx Investments Planning
- OpEx Costs Analysis
- Monthly Business Report
- Annual budget
- Investment risk pyramids
- Finance data charts
- Trade finance concepts
- Due diligence process and types
- Stock financial report
Financial Report and Performance Indicators Report
Financial reviews full of data usually contain dozens of tables and are typically hard to understand. Half of the job is to put all figures in one place, and another is to visualize them in a way that is clear for non-financial audiences. Copying your Excel table into PowerPoint as is, is not enough if you want to create a visually appealing presentation.
If you need to prepare such a comprehensive financial performance report, including income statements, balance sheets, cash flow, profit and loss reports, revenue and profit snapshots, a financial report and metrics PPT graphics template is the one to go with. It includes slides for presenting all mentioned topics and you can use these slides to present key financial information to both internal and external stakeholders by covering every aspect of financial affairs.
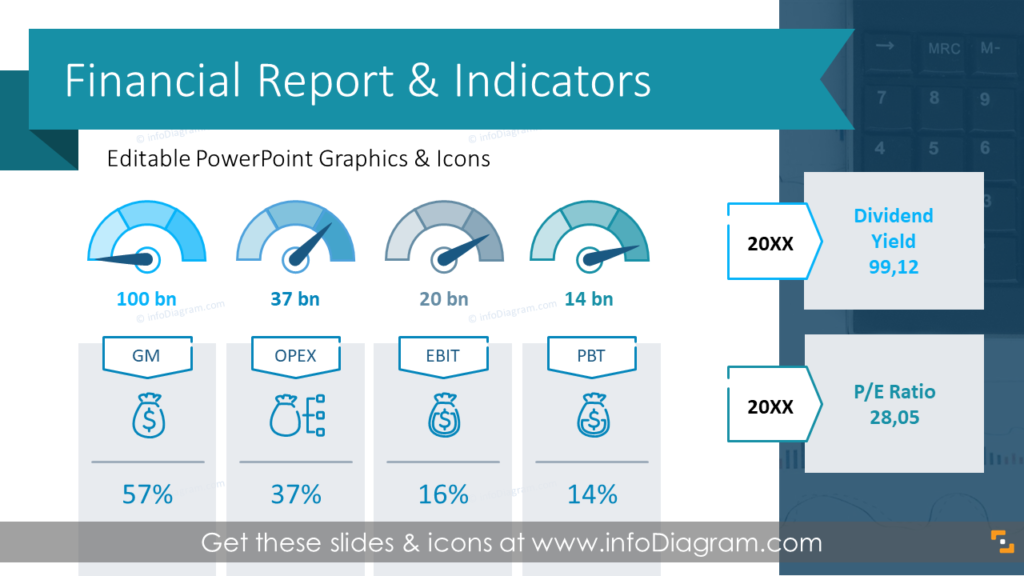
You can use financial report visuals to:
- Design a financial summary overview with easy-to-track key metrics
- Create revenue and profit snapshots
- Illustrate sales distribution
- Describe your revenue key growth drivers
- Present your profit and loss statement
- List key factors influencing your gross margin
- Describe your main profit drivers – factors impacting your bottom line
- Present your balance sheet including assets, liabilities, and equity details
- Design clean cash flow statements
See how to prepare structured and professional financial slides using PowerPoint tools.
Listed Company Financial Report Presentation
Similar to the first financial report mentioned in this blog, the listed company financial report template features a layout collection for creating income statements, balance sheets, cash flow, cost breakdown, financial ratios analysis slides, and more.
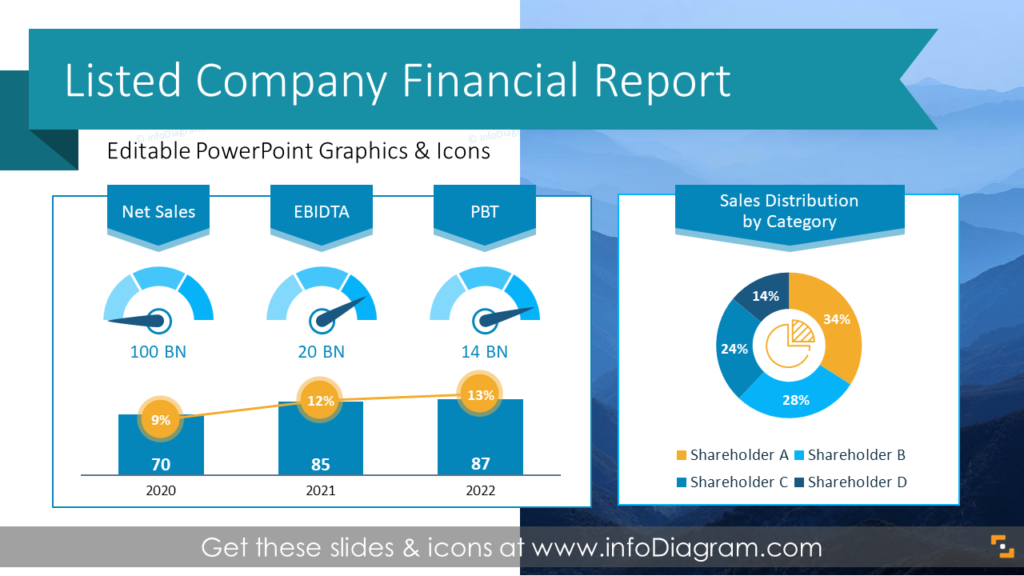
A few ways you can use the graphics from this deck:
- Capture key financial facts and present basic information about the publicly traded company
- Provide an insight into company revenue highlights and annual revenue growth and profit drivers
- Share the profit and loss statement of a listed company
- Showcase the financial, growth, and profitability performance metrics
- Present the share price fluctuation and yearly earnings per share
- Illustrate capital market ratios and put together a performance dashboard
Half-Year Sales Report
Retail data becomes far more impactful when visualized clearly. Using a professionally designed PowerPoint template allows you to turn raw numbers into easy-to-read charts, dashboards, and tables. It helps you to tell story behind those retail data. Your audience can grasp key trends at a glance. And your presentation will look more polished and executive-ready.
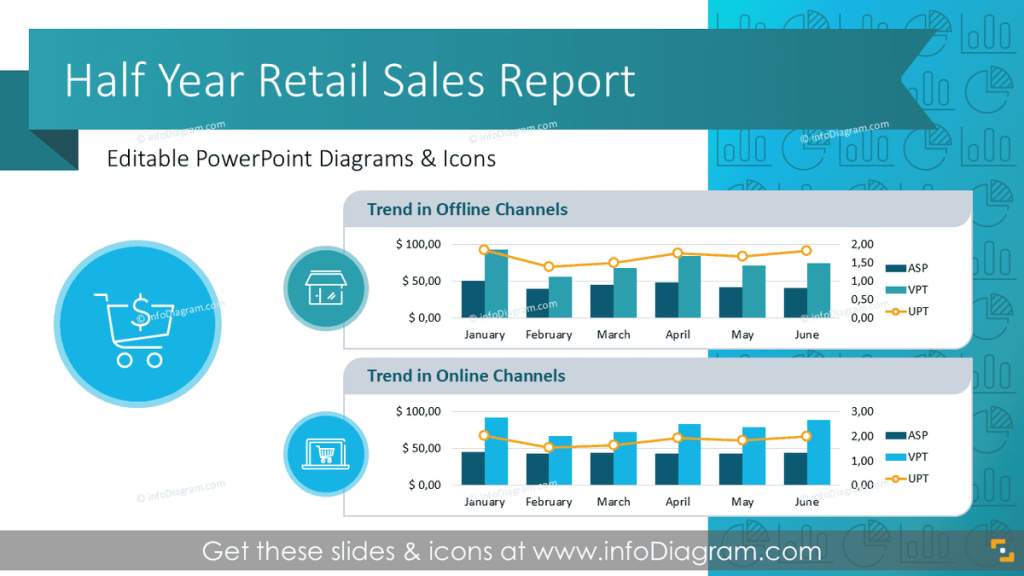
This PowerPoint template is useful in a variety of business settings, including:
- Presenting half-year results to executive teams or retail leadership
- Sharing store-level performance in internal reviews
- Highlighting sales KPIs for board meetings or investor updates
- Comparing year-over-year or quarter-over-quarter sales
- Visualizing trends across online and offline channels
- Supporting sales strategy planning for the second half of the year
Such a presentation can be used by retail managers, analysts, and sales leads. It helps you present your half-year results in a professional and visually compelling way.
CapEx Investments Planning
CapEx analysis, or capital expenditure analysis, involves evaluating the potential return on investment (ROI) and financial implications of a company’s capital expenditures. It helps businesses make informed decisions about allocating funds to capital projects, such as purchasing new equipment, expanding facilities, or investing in technology upgrades.
CapEx analysis is critical for businesses to evaluate investment opportunities, allocate resources effectively, and make strategic decisions about capital expenditures that drive long-term growth and profitability. Companies can optimize their investment decisions and enhance shareholder value by systematically analyzing capital projects’ financial implications, risks, and strategic alignment.
An effective way to communicate CapEx investment planning is to present your capital expenditures in a readable PowerPoint format. This will allow you to use visual aids appropriate for your business. We designed a CapEx PPT Template that is easy to edit and adapt to your content and the look and feel of the data charts.
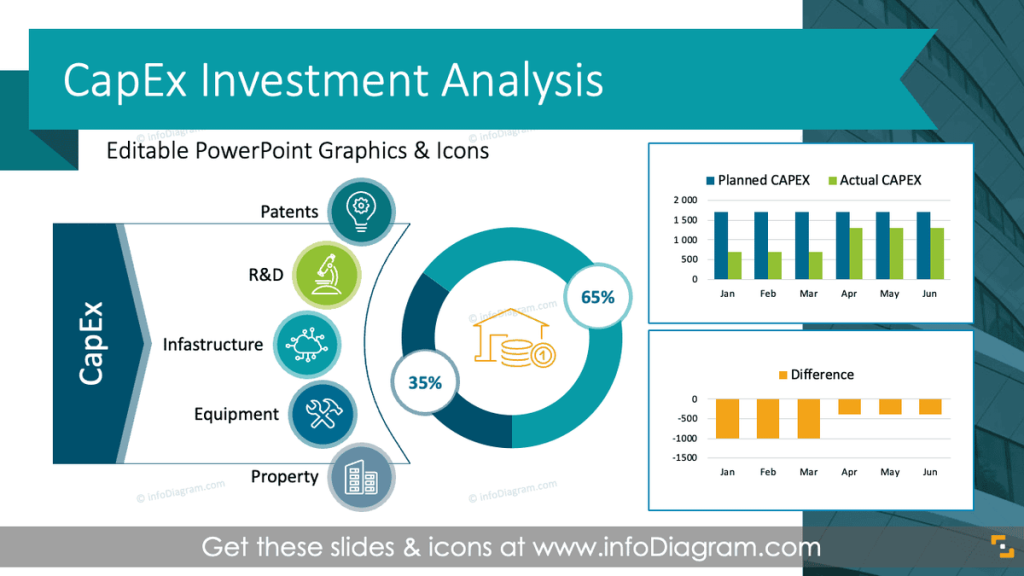
Using infographics in your capital expenses performance follow-up will help you organize information in a visually appealing format and present your numbers in a compelling way that is easy for your audience to understand.
- Describe your CapEx approval process using 5 steps diagram.
- Present your CapEx budget assumptions and key success metrics, adding relevant icons that reinforce your message.
- Show your project’s scope, detailing the elements and adding comments.
- Assess/compare your investment projects using a pre-designed table with all necessary elements included.
- Illustrate your CapEx breakdown by various categories visualized in pie and column charts.
OpEx Costs Analysis
OpEx analysis examines and evaluates a company’s operational expenditures to gain insights into its financial performance, cost structure, and efficiency. This analysis helps businesses make informed decisions, control costs, and identify areas for improvement.
OpEx analysis is essential for effective financial management, performance evaluation, and organizational strategic decision-making. By leveraging OpEx analysis tools and techniques, businesses can optimize costs, improve profitability, and achieve long-term success in today’s competitive business environment. Present your costs using infographics appropriate for your business from our content-ready deck to upgrade your presentation slides. Our slides are effortless to edit. We include detailed instructions on how to alter the content, values, colours, and look and feel of the charts, diagrams, or icons.
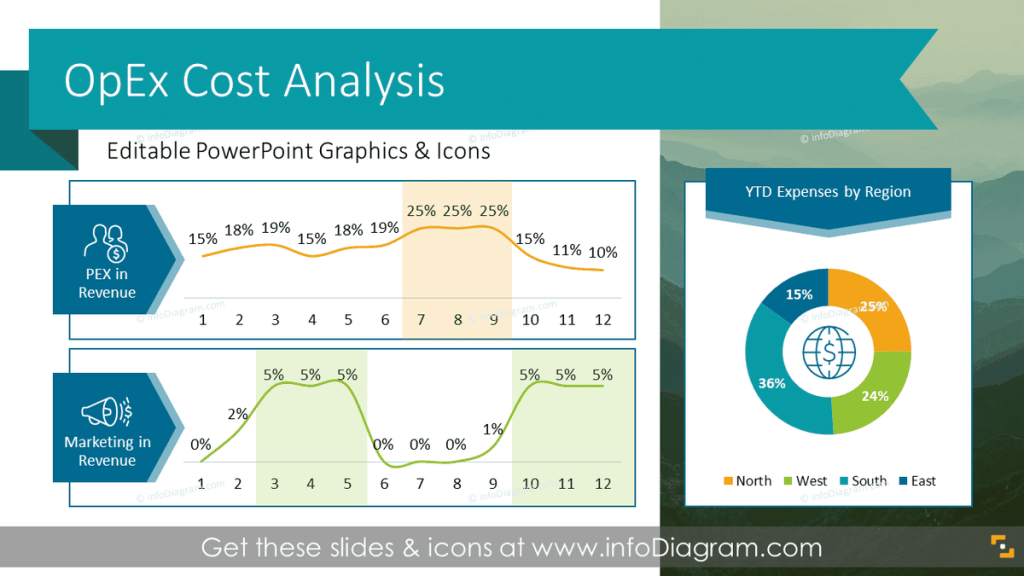
Using infographics in your operational expenses performance follow-up will help you organize information in a visually appealing format and present your numbers in a compelling way that is easy for your audience to understand.
- Design a clear bridge from your Gross Margin to EBITDA.
- Break down your expenses into main categories and provide comments on 4 major cost drivers.
- Create an attractive overview of your costs, showing cost-to-sales ratios in a chart enriched by relevant icons.
- Summarize your monthly spending split by cost centres versus budget.
- Illustrate your main cost drivers in an appealing, colourful stacked chart.
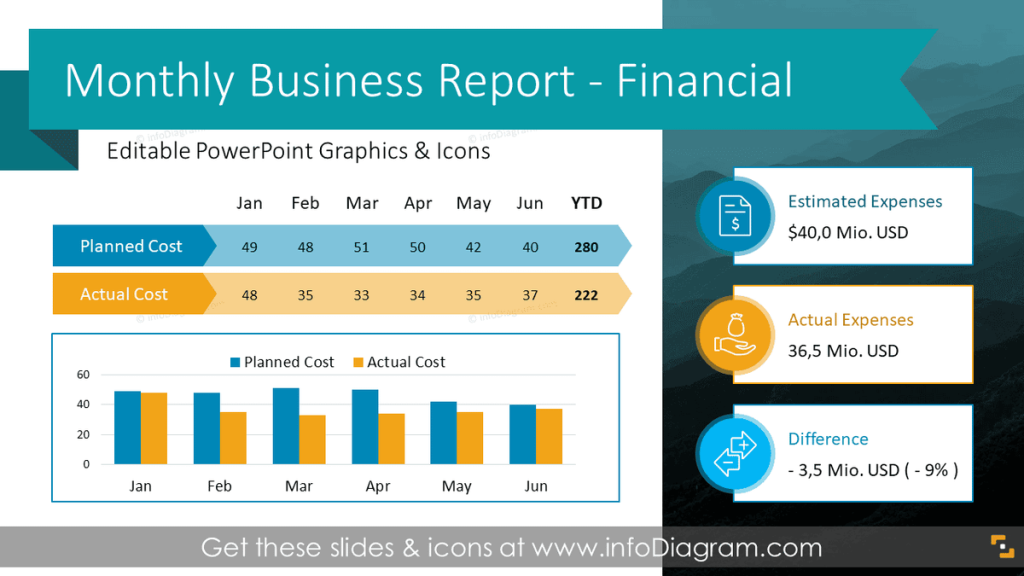
Monthly Business Report
A monthly business report (MBR) is a structured presentation in which an organization assesses its performance, reviews vital metrics, and evaluates progress toward strategic goals every month.
Monthly management reports are reviews and assessments of the company’s financial and operational performance. They enable the management team to track the past and present performance of the company and assist in making informed business decisions. If you would like to track your performance against your business objectives appealingly, use our slides, which are very easy to edit/add personalized comments to. We include detailed instructions on altering the charts, diagrams, and icons’ content, values, colors, and look and feel.
Using infographics in your monthly performance follow-up will help you organize information in a visually appealing format and present your numbers in a compelling way that is easy for your audience to understand.
- Summarize the top and bottom lines results of the previous month and define your next period expectations.
- Assess your company’s overall financial performance by adding relevant comments in a pre-designed box.
- Present your P&L; in an attractive waterfall format that allows you to see the elements impacting your profit.
- Benchmark your company’s actual performance—both last month’s and year-to-date results against expected performance, meaning versus budget and last year’s figures. This will show the overall picture and compare various business units.
Annual Budget Financial Presentation
It can be challenging to persuade people into certain financial decisions. If you are presenting the estimation of revenue and expenses and want to make an impression on your executives, put the content into visual form to support your thoughts. Turning default budget tables to a more infographics-like format will definitely help engage your listeners.
The annual budget PPT slides collection contains templates for presenting financial forecasts, executive summaries, revenue, expenditure, strategic goals, OPEX and CAPEX investment, marketing budget, risk analysis calculations, sensitivity analysis, and more.
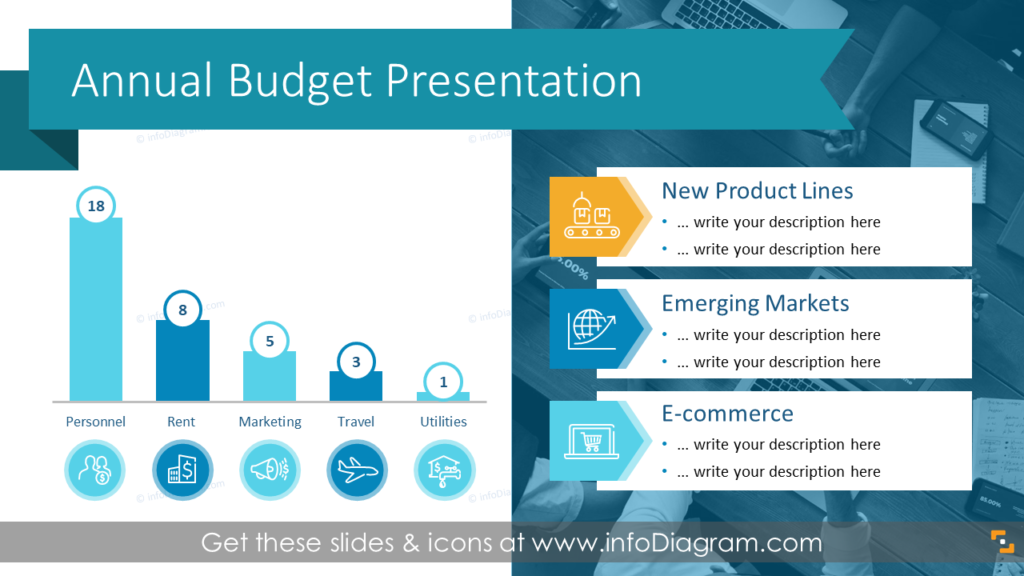
This deck contains templates for illustrating the following subtopics, which are usually a part of a corporate budget:
- Revenue budget, with main revenue sources, sales distributions, and key growth drivers
- Expenditure budget with operational cost presentations, key cost drivers, OPEX, and capital expenditures
- Marketing budget allocation
- Sensitivity analysis and risk assessment
- Organization costs and structure
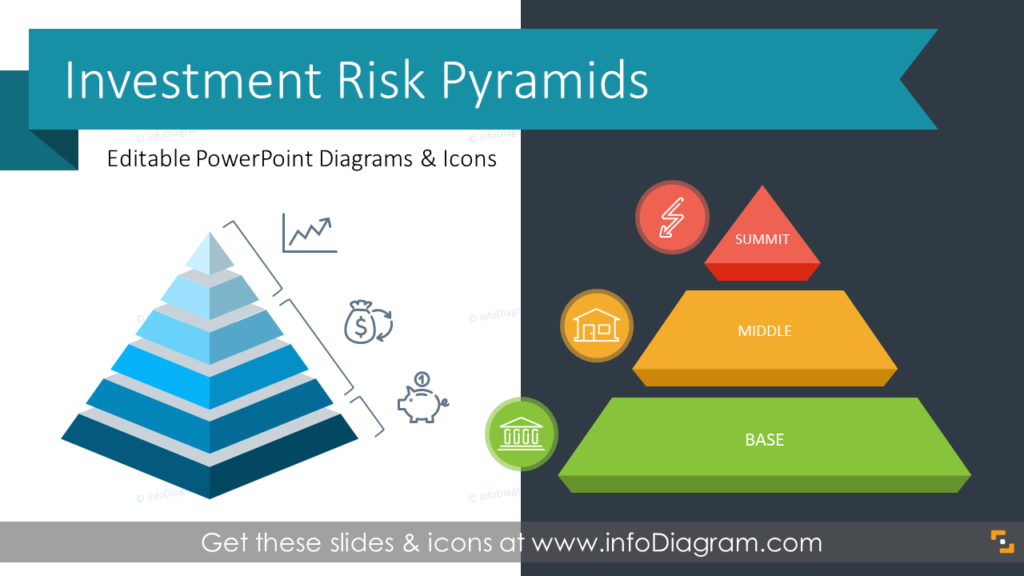
Investment Risk Pyramids
If you want to present various financial investment options, pyramid visualization will help you successfully explain various risk levels and the potential rewards. Such a diagram allows seeing the hierarchy of certain parameters better. Therefore, it will help stakeholders understand the risk profile assessment or risk mitigation approach clearly.
Risk pyramids PPT graphics collection contains diagrams with various levels to illustrate financial investment risk levels related to your business, factors influencing risk, reward dependencies, risk tools, and hazard control.
Company Finance Data Charts
Charts are a great visual tool if you need to show dependencies or time trends of specific financial concepts, like cost distribution, explain company profitability, break down CAPEX and OPEX costs, focus on KPIs, or combine financial information on one slide to show a nig picture.
To create a clear and informative financial report, try to enhance it using graphics from the finance PPT data charts deck.
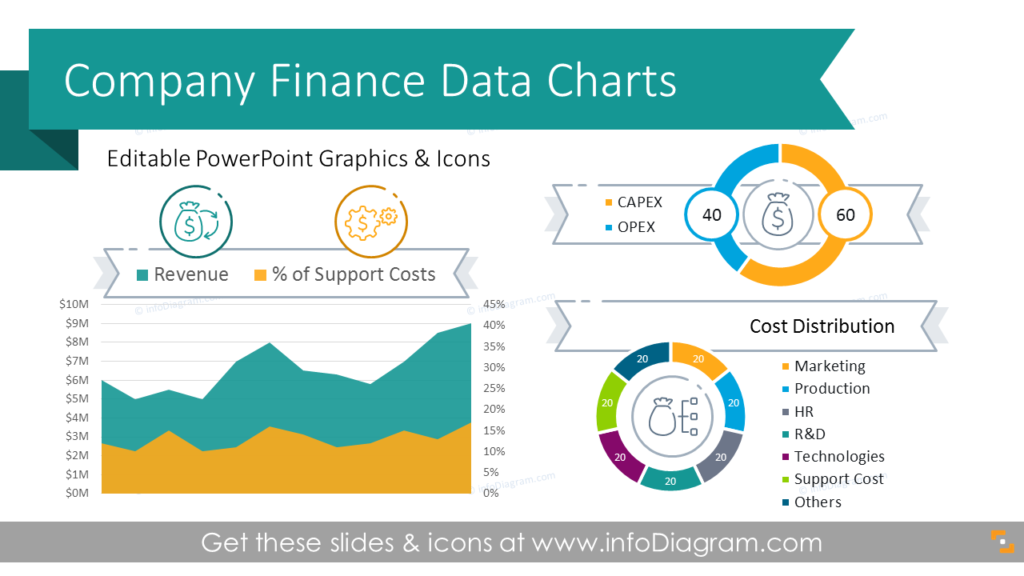
You can use these data charts to illustrate the following topics:
- Company profitability trends
- Cost distribution
- CAPEX and OPEX comparison
- Company revenue monthly review
- Return of company assets over a year (or any other period)
- Operating profit margin
- Goal completion degree dashboard
- Performance diagram
To enhance charts even further, see ideas on how radar diagrams, gauges, and radial charts can be used in presentations.
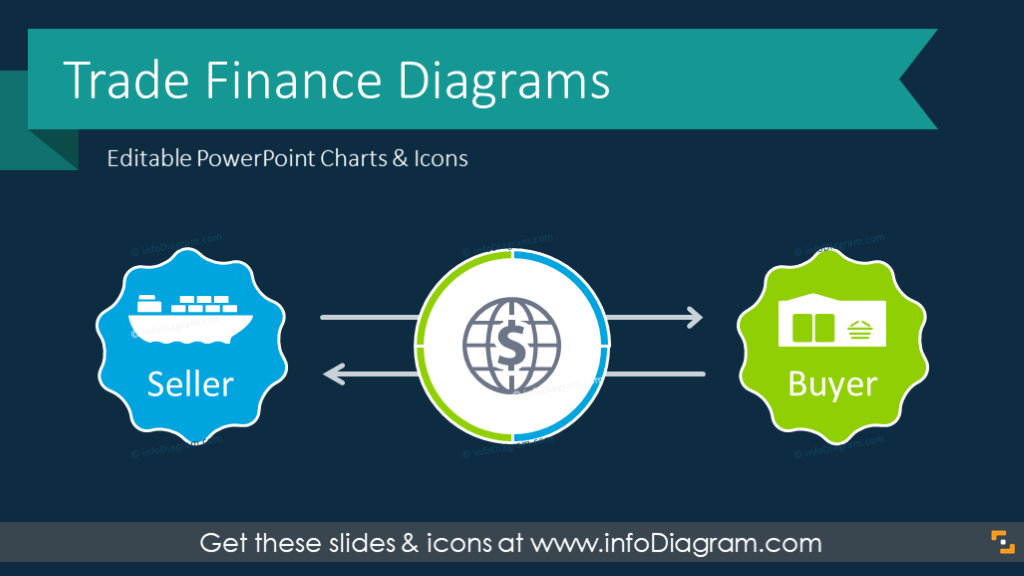
Trade Finance Diagrams
If you will be talking about trade finance or global trading concepts, visual diagrams can help illustrate these concepts and show how mechanisms work.
The trade finance PowerPoint template includes slides for explaining relations between sellers, buyers and intermediaries, providers and users, methods of payment, trade world map, commodity finance trade cycle, and more.
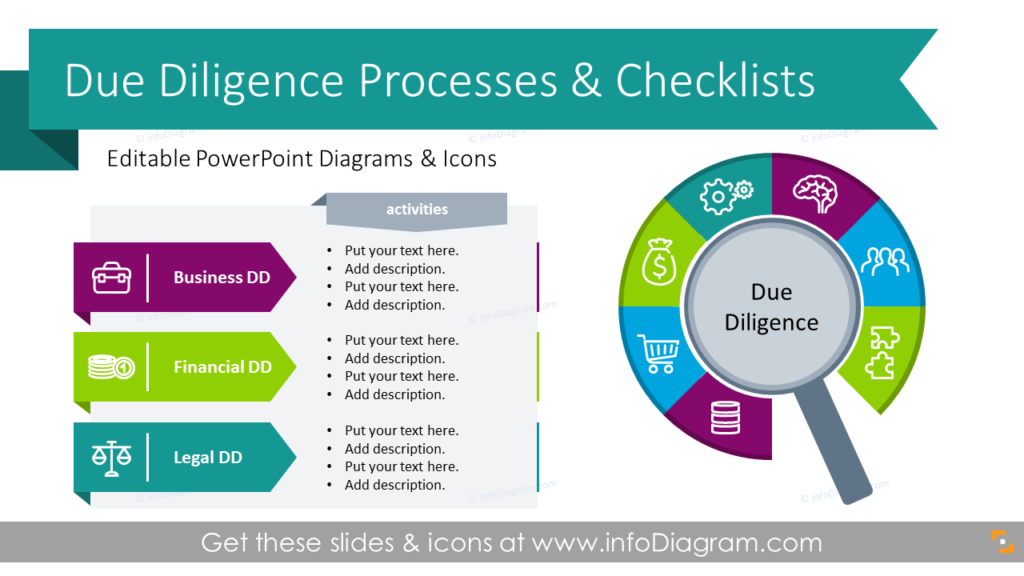
Due Diligence Presentation
Usually, topics like due diligence are presented with long text boxes and raw bullet points. Breaking the complex topic into multiple sections helps the audience to understand the topic more effectively.
The due diligence PPT slide deck includes templates for describing its definition, processes, types, checklists, M&A process, action plans, and frameworks.
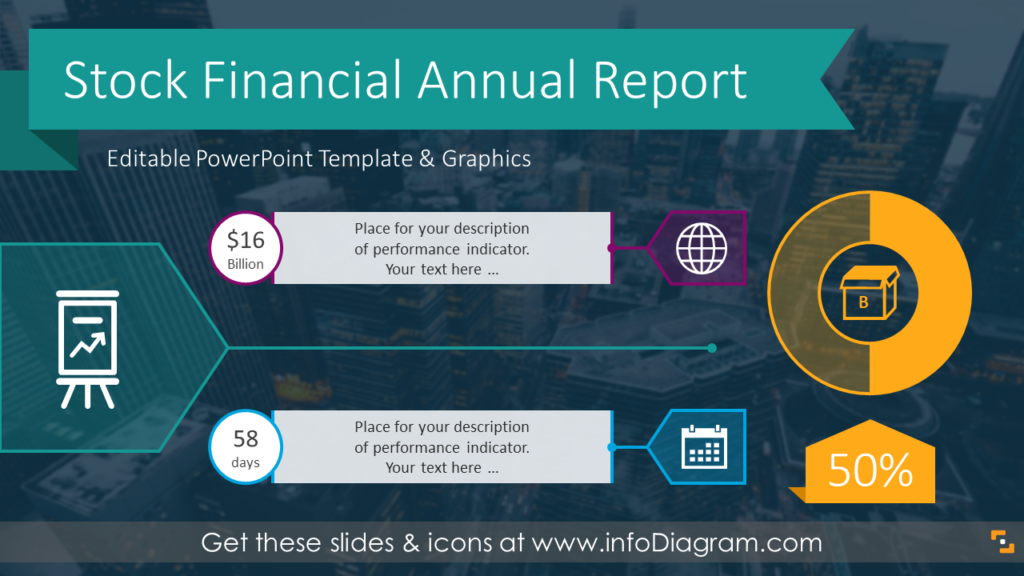
Stock Financial Annual Report
If you are working on a comprehensive stock financial performance report for investors or the company board, you need to make sure this information is presented in a clear structured way. Plain slides containing lots of figures and without any accents will make it harder for you to talk to your audience.
The stock financial annual report contains layouts for illustrating product sales volume, executive leadership team, market relevance statements, financial charts and tables with main fiscal data, company values, world and US maps, and more.
Summary of the essential graphics for financial presentations
Presentations and documents on finance-related topics are often complex. Visuals will help your listeners or readers understand the meaning behind the data better and therefore make the right conclusions and decisions. You don’t need to overcomplicate it and spend hours preparing the deck, start with adding icons or transforming text into a simple diagram. Having a collection of editable PowerPoint templates can make your work easier.
Resources: PowerPoint Decks to Use for Financial Presentations
The above slide decks are PowerPoint templates for finance-related talks that can help you express complicated topics more effectively and appealingly. If you find any of the above decks useful, you can download all the source illustrations below. All mentioned presentation slides are available here:
To try out how those graphics work, get a sample of free PowerPoint diagrams and icons that you can use to play with these visuals.


