Present an Artificial Intelligence Story with Compelling PPT Graphics
How to present complex AI technology and concepts in a catchy way? Let us share here a few presentation examples illustrating Artificial Intelligence technologies, applications, and background.
By definition, Artificial Intelligence deals with the simulation of intelligent behavior and intelligence in computers and technology. Machine Learning refers to sets of computer algorithms that are able to learn. They are usually not explicitly programmed to do so.
These concepts can be challenging to share with others, especially those who operate outside of technology fields. There are many businesses that use AI which aren’t technologically based. Some examples are retail businesses that perform market analyses and use dynamic pricing; banks that perform credit scoring; production and manufacturing businesses that optimize processes.
Disclaimer: The AI infographics we present here comes from the commercial AI & Machine Learning PPT Diagrams that we’ve designed.
Provide Definitions for Unfamiliar Terms
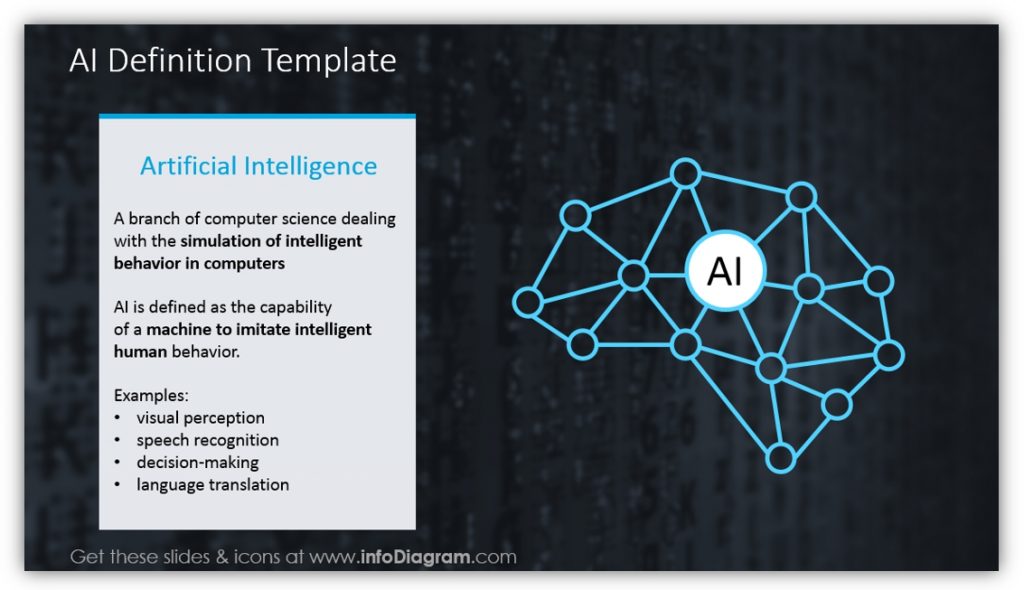
When you’ll be discussing terms your audience may not be familiar with or understand, you should provide the definitions and any examples or notes your audience may need to follow along. If you want your audience to retain the information you are sharing then you will need them to understand it in the first place.
Utilize Smart Quotes to Drive Your Points Home
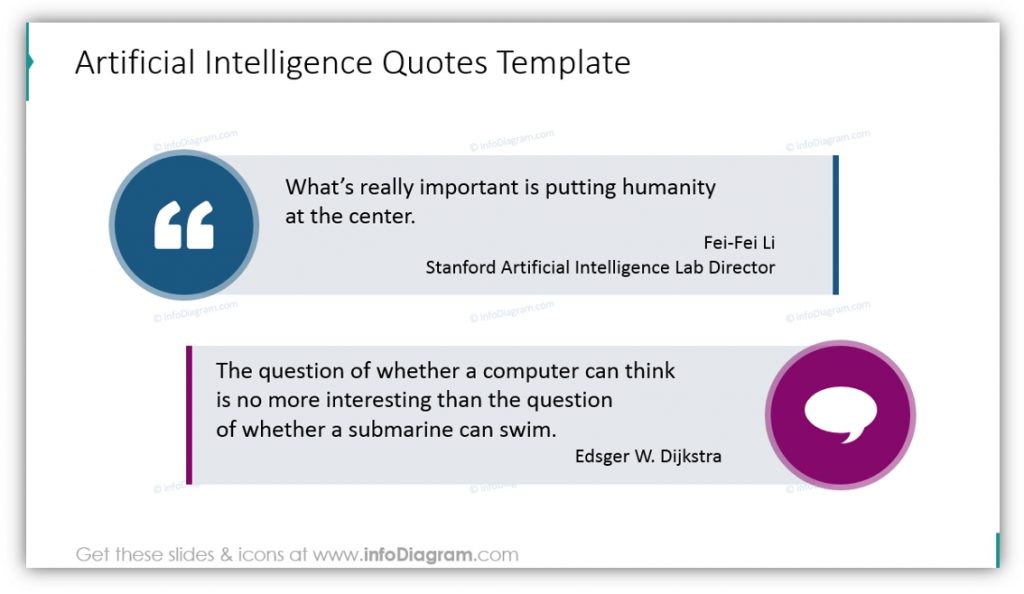
Pictures are worth 1,000 words, but sometimes the words help. If a scientist, historical figure, or other person has said something especially profound regarding AI, share it! The quote doesn’t need to be remarkable if it supports the points you’re trying to make.
Use a Circle Diagram to Explain Different AI Technologies
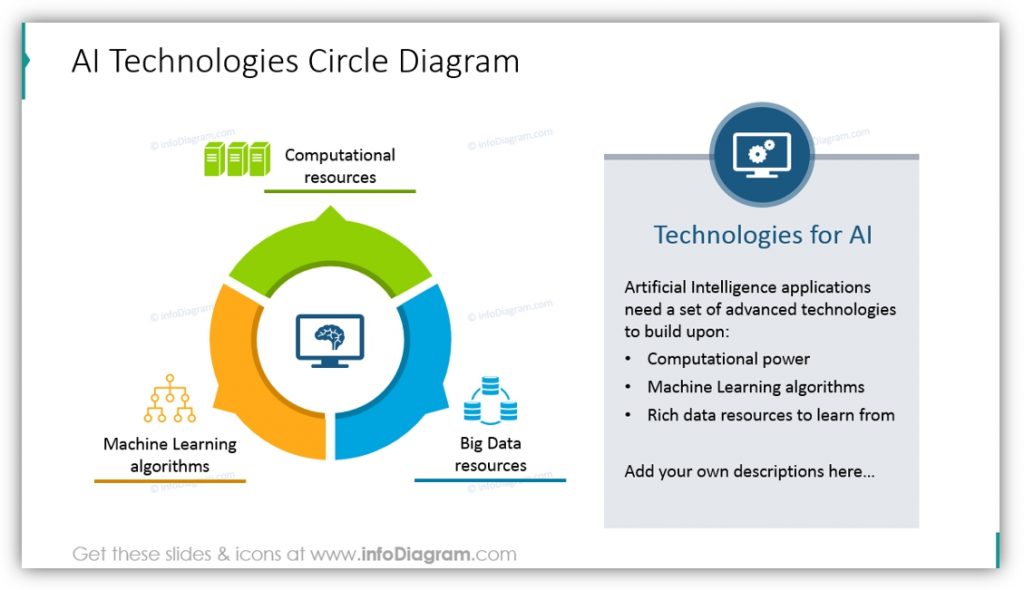
Whether you need to discuss the differences between AI technologies or simply acknowledge that the different types of tech exist, this circle diagram can help. You can customize the colors, sizes, and add or modify the text so the diagram says whatever you need it to. You can modify the icons used to represent the different technologies or add additional ones as your presentation requires. You can also add supplementary information in text boxes if there isn’t sufficient room in the diagram labels.
Use Honeycomb Diagrams or Visual Lists to Share the Industries Using AI
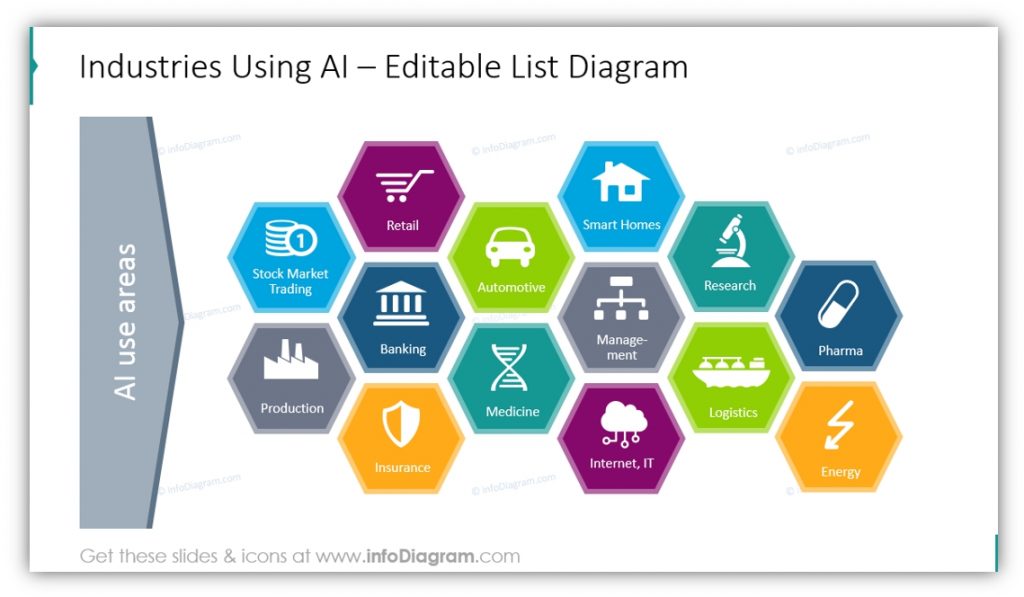
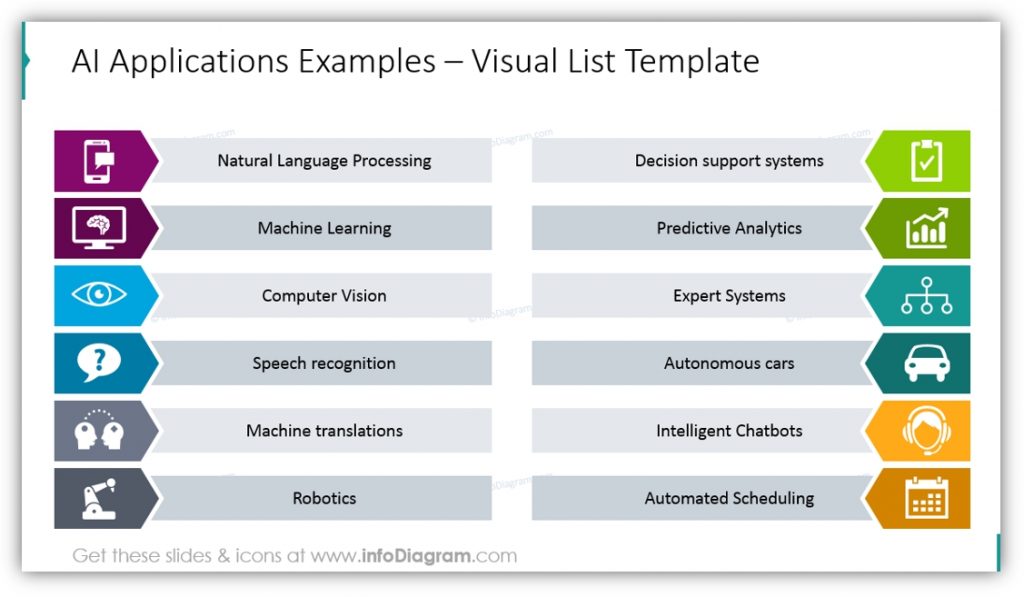
Images are more powerful than plain text-based lists. The honeycomb diagram makes use of different colors and icons, all of which can be customized. The Visual List Template provides you with more room to describe the different industries using AI. You could also use these list diagrams to serve other purposes.
Explain Timelines using Specialty Diagrams
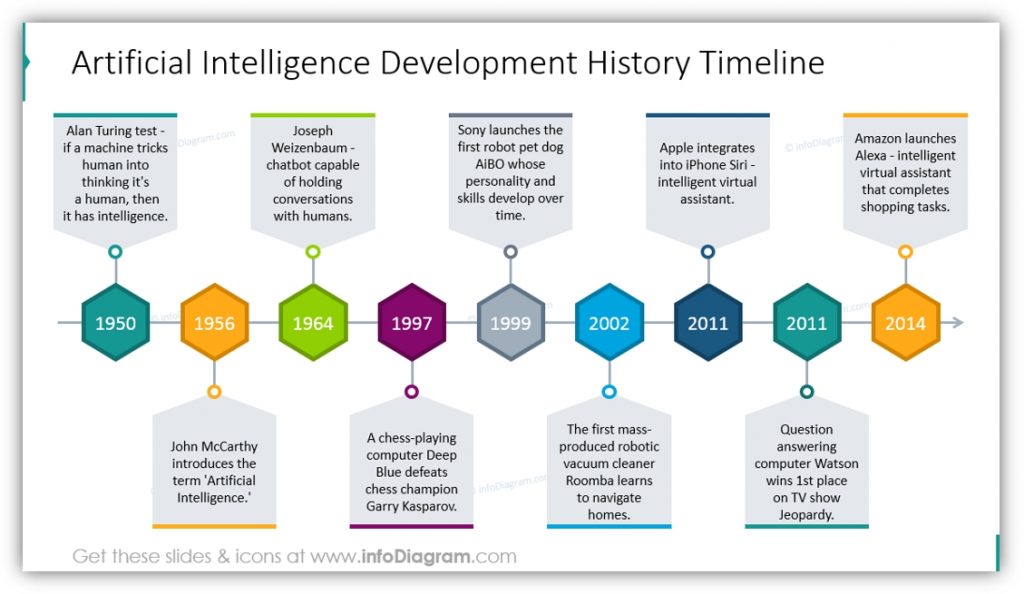
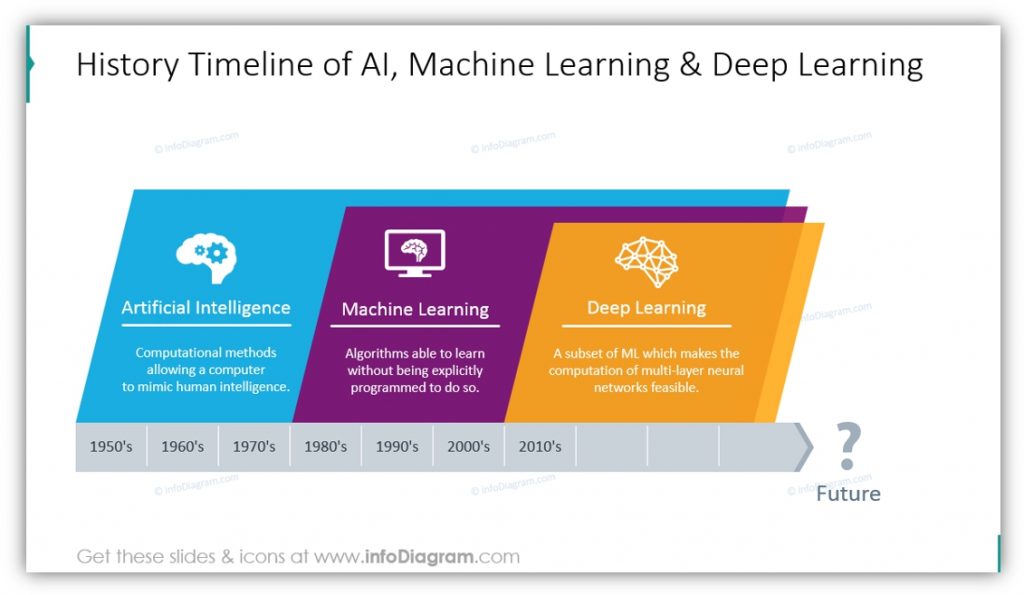
You can use diagrams like these to explain the evolution of Artificial Intelligence or to share how you anticipate AI will progress in the future. Sharing a complete history as expansive as the history of AI can be confusing or dense, but by sharing details in text or by incorporating visual icons, you can be sure your audience will both follow along and retain the information.
By giving your audience the definitions of unfamiliar words or outlining timelines for them, you’re ensuring they will be able to follow along throughout your presentation. By sharing relevant quotes, you will ensure your audience can relate to the material. You can also share the different types of AI and the industries which use it – all with the same modern icon set.
Resource: AI & Machine Learning Presentation Diagrams
Modern icons and visuals will help even the least tech-savvy audience member follow along and better understand the content of an AI presentation. Diagrams like these will help explain concepts used in either Machine Learning or Artificial Intelligence. The icons are not only eye-catching, but they make the complicated information clear. By using the icons intended to represent machine learning, deep learning, clustering, clutter, and more you’ll be able to simplify your message.
If you find the above examples useful or helpful you can down the full diagram set here:
Related articles with examples of presenting AI and IT topics:
- Preseting AI project proposal in PowerPoint
- Explaining Machine Learning algoritms
You can also download 200+ creative PowerPoint diagrams, including timelines, lists and comparisons for more presentation graphic variety.


