Executive Presentation Templates: 7 Visual PowerPoint Slide Examples
Elevate your executive presentations with 7 visual PowerPoint templates. See professional slide examples for C-suite meetings, board reports, and leadership updates.
Presenting topics typical for executive management, such as long-term strategies, business models or company objectives deserves spending extra time on preparing clear visual communication.
Here you’ll find our recommendations for PowerPoint slide decks that can be a source of graphical inspiration for you.
Get inspired by this selection of visuals for communicating your insights and key points efficiently and deliver that presentation with impact.
You can get any slide deck presented here as an editable PPT file. Click on the slide pictures to see and download the source illustration. Check the full collection of Operational Management and Planning Presentation Templates here.
We’ve put down a several executive presentations examples. You can use them as a whole presentation or just copy specific slides and graphics:
- OKR Framework: Objectives Key Results
- Responsibility Assignment RACI Matrix
- SWOT Analysis
- Product and Strategy Roadmap Tables
- Status Review Meeting
- 30-60-90 Day Action Plan
- SMART Goal Planning
Objectives and Key Results (OKR) Infographics
OKR is a goal-setting methodology to set challenging, ambitious goals with measurable results. Even if you don’t utilize the OKR methodology within your company, you might still need to talk about tracking and measuring objectives, progress over time, or monthly/quarterly achievements and failures. See Objectives and Key Results Performance Review deck with slides to illustrate OKR concepts, goal setting processes, progress tracking, and performance reports.
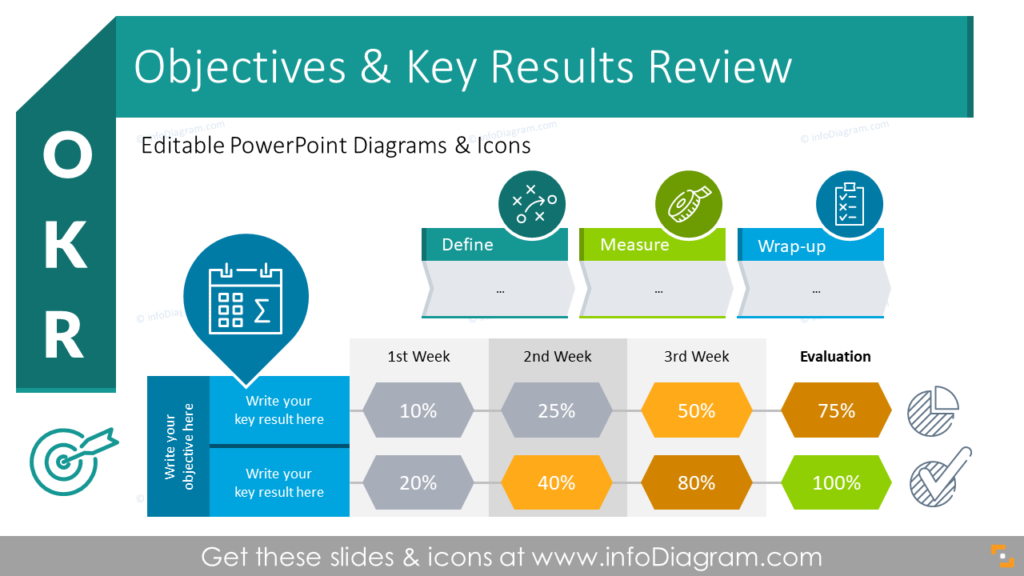
You can also explore our ideas on showing improvement or failure concepts with icons, which often appear in presentations related to goal reviews.
Responsibility Assignment RACI Matrix
The RACI matrix is used for assigning job tasks and defining work breakdowns. It’s a valuable project management tool that will help you identify roles assigned to each duty: Responsible, Accountable, Consulted, and Informed. Such a table can help give you an overview of who’s in charge of what between team members.
Creating your own matrix can be pretty time-consuming – have a look at our pre-designed RACI matrix diagrams that will help you create clear slides faster.
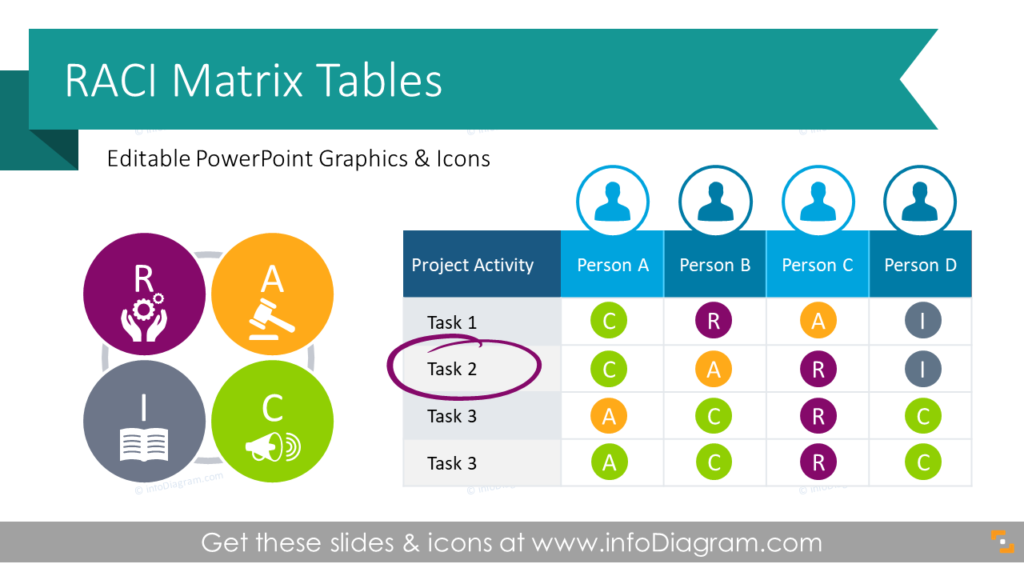
Examples of using RACI matrix graphics:
- Illustrating higher-level project milestone responsibilities
- Drawing a map of personnel occupation status and evaluating your group’s capacity for the next assignment(s)
- Explaining people and work management theories
SWOT Analysis Presentation Diagrams
The SWOT analysis is a well-known strategic planning and management technique, which is very often included in executive presentations or marketing reports. SWOT can be used to influence stakeholders’ decisions, so it’s important to illustrate it effectively to make an impact on your audience. Check our SWOT analysis diagrams collection for inspiration.
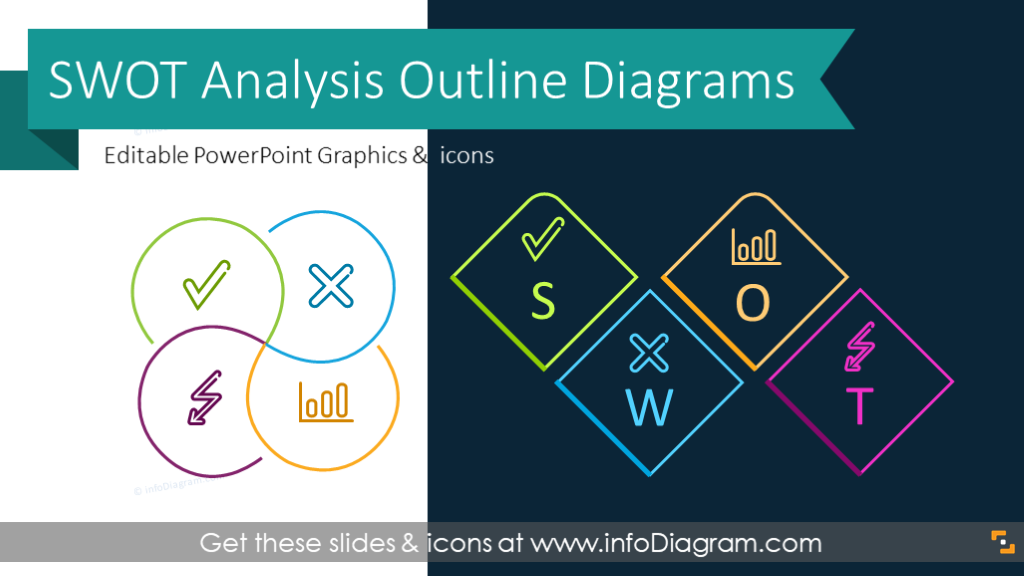
See more ideas on how to display SWOT analysis findings here. Also, explore our icon ideas to illustrate strength and weakness concepts. Even 1 small image can make a difference to your presentation.
Product and Strategy Roadmap Presentation Tables
Whether you need to present a company strategy, show the history of your business projects, or plan product/software development and launches, roadmap graphics and tables are great visuals for visualizing these concepts. This Product and Strategy Roadmap Presentation Tables deck is designed to help you get rid of text and make the content more visual.
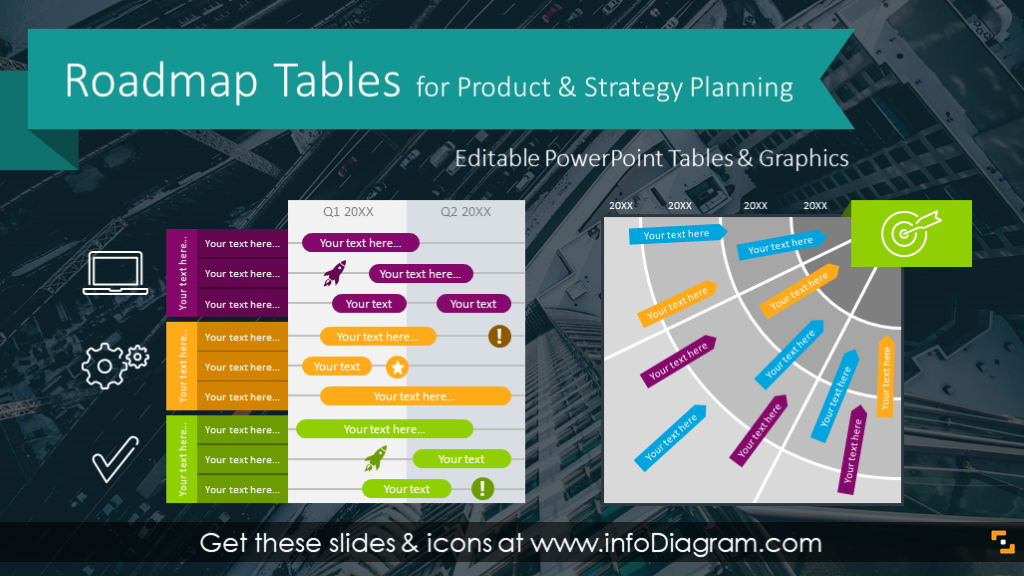
These roadmaps tables can be used in a broad spectrum of contexts:
- Illustrating a long-term strategy of a company
- Showing a history of your business activities
- Planning a product development and launch journey
- Reviewing the current status of completed parts of a project
Review Meeting Template
For your team to work together, you need to communicate clearly about the goals you have and make sure they know where things stand with their projects. However, one pitfall is that review meetings and brainstorming sessions take too much time – especially if they are unorganized and not structured properly.
To facilitate team meetings effectively and find the best solutions, you can use a Status Review Meeting set of slides that will help you present various meeting topics.
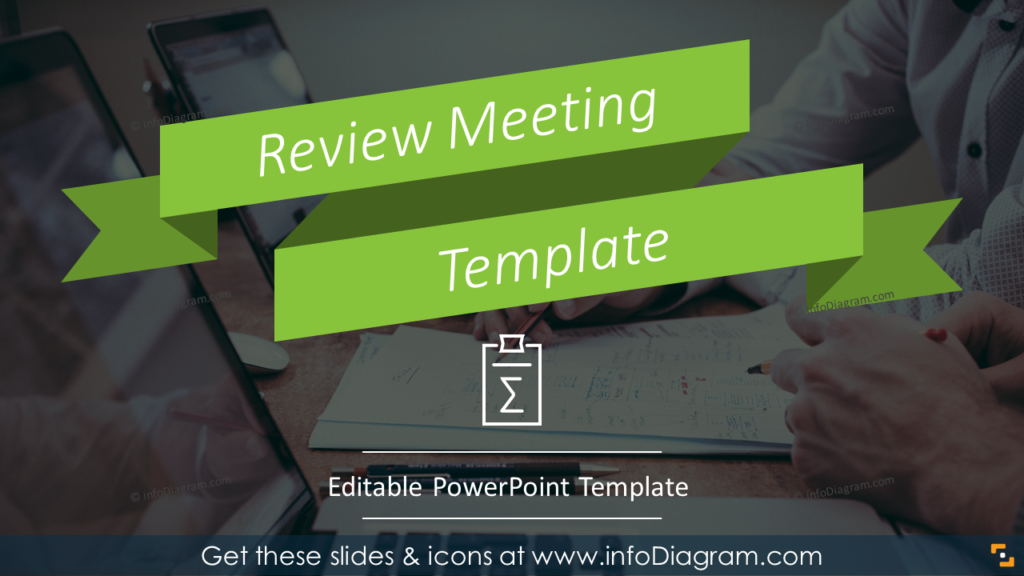
You can use these presentations graphics to:
- Keep track of your business’s next steps
- Outline what topics will be discussed
- Show clearly meeting agenda, structure, and outcomes
- Create lists, agendas, timelines, and further steps diagrams
- Evaluate the current market and company situation, present key market data and KPI numbers
- Adjust strategy to this situation, set new objectives
- Distribute new tasks over a timed schedule and hold people accountable
Explore more ideas on how to manage an effective review meeting and visual examples of various meeting sections here. If you’re holding an annual review or strategy planning meeting, have a look at the following deck collection.
30-60-90 Day Action Plan
If you’re interviewing for a management position or need to present a plan for accomplishing a big goal, 30-60-90 Day Action Plan graphics can help you visualize your proposals.
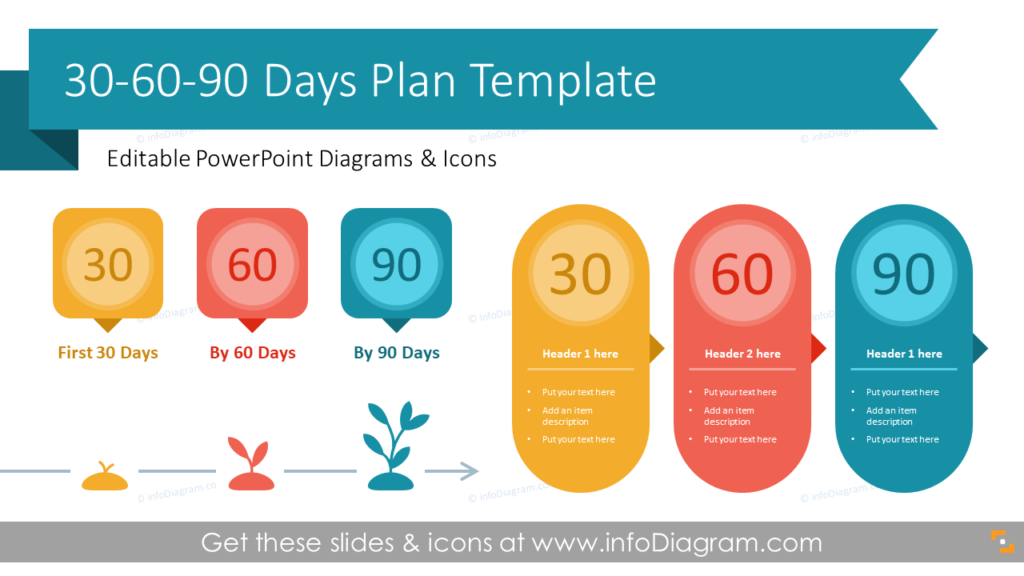
You can also use these graphics while creating an actionable project template to divide big goals into manageable tasks or show end goals during the performance review. You can also use these infographics to:
- Show a detailed plan for every 30 days using minimalistic diagram graphics
- Visualize a development plan using growing plant graphics to show improvements
- Design a roadmap to show every milestone
- Create timing and budget plans with timing deadlines and cost estimations
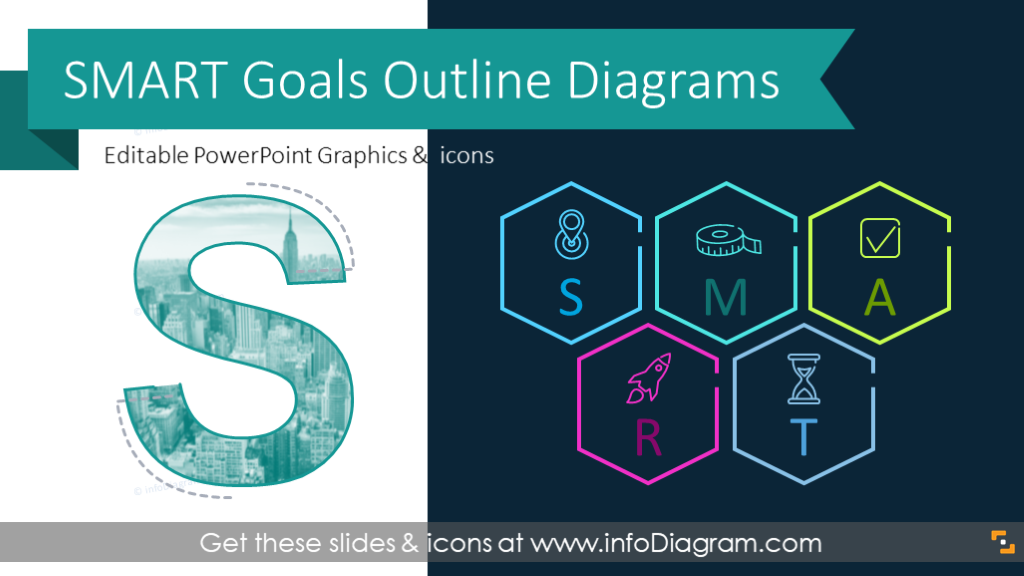
SMART Goals and Objectives Planning Template
SMART goal methodology helps to bring structure and trackability to your goals. Setting SMART goals means you can clarify your ideas, focus your efforts, and use your time and resources productively. Check this SMART Goal Diagram collection in an outline style, that will help you present your objectives and how you plan to reach them.
We hope you got inspired by these visual examples, feel free to explore and reuse those ideas for executive presentations and management meetings.
Concluding – why power of visual aids
When preparing a business presentation, finding the perfect balance between information presented in text and graphics is important. One way you can try is by experimenting. Start with replacing bulleted lists by a SmartArt diagram, for start. Try to enhance default tables by adjusting their look – use colors for key items, keep content readable, illustrate with graphical symbols.
If you are adding slides to your existing PowerPoint file from another deck, see how to keep the whole presentation consistent by following simple steps.
With the help of these PowerPoint decks full of various diagrams and icons, you can save time spent on design and create an appealing set of slides. If you are often presenting during company meetings, it’s handy to have a collection of pre-designed diagrams and icons at hand.
Resources: Diagrams and PPT Templates for Executive Presentations
If you like any of the examples above, explore all the source illustrations for commercial use and free modifications. All slide decks in this blog, and many more, are available in the infoDiagram collection:
Further design inspiration for executive presentations
Here are more resources to find the right infographics and visuals for presenting your ideas:
- Presenting Change Management Models
- Illustrating the Executive Summary concept in a Presentation
- Present Your Company’s Progress on One Slide
- How to Show Leadership in a Presentation by One Icon
- Get a free sample of PowerPoint diagrams and icons to try out how our diagrams work.
For more dynamic presentation of business slides makeovers, check our YouTube channel with examples like this one:


