
Illustrating Executive Data Report with PowerPoint Dashboards
Do you need to present multiple data charts and KPIs? Don’t know how…
Various graphical styles to add creative elements to your presentation slides. These ideas will help you deliver a powerful message, design less generic and more appealing slides, and engage your audience.
Do you need to present multiple data charts and KPIs? Don’t know how…
Did you know you can use PowerPoint as an Image Editor? That’s right!…

Are you preparing infographic tables for your presentation? Do you need to show…

Are you preparing slides about market segmentation? Or you’re working on a presentation…

Tables can help you present your information or data effectively. If you want…
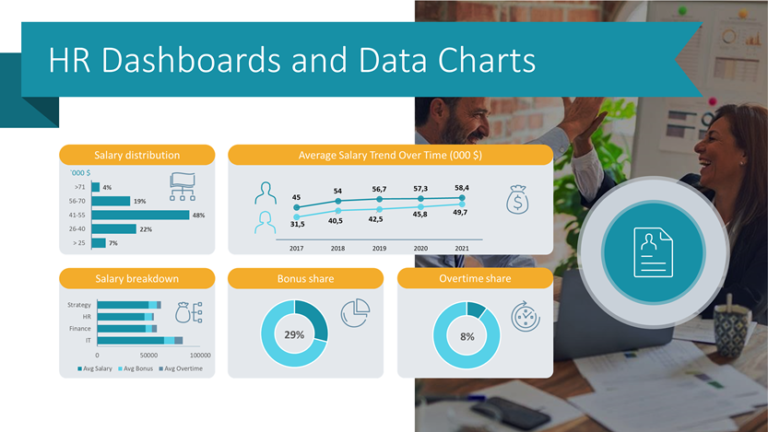
Need to present human resources-related metrics? Use an organized way to display important…
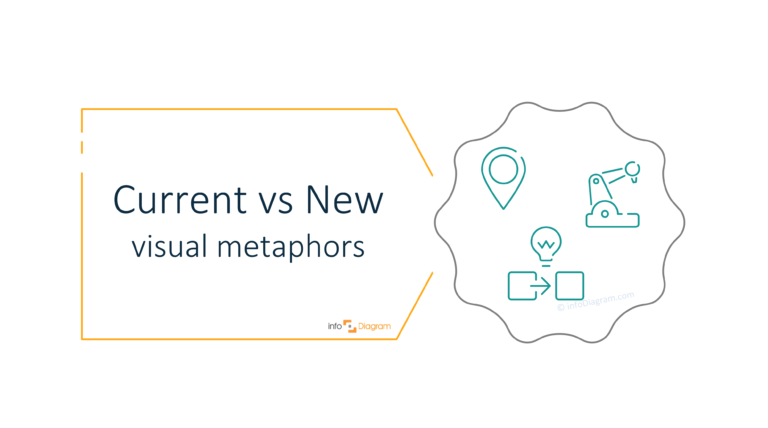
Comparing present-day ideas or projects with innovative ones? If you need to show…

Need an appealing symbol to illustrate a list of actions, process steps, or…
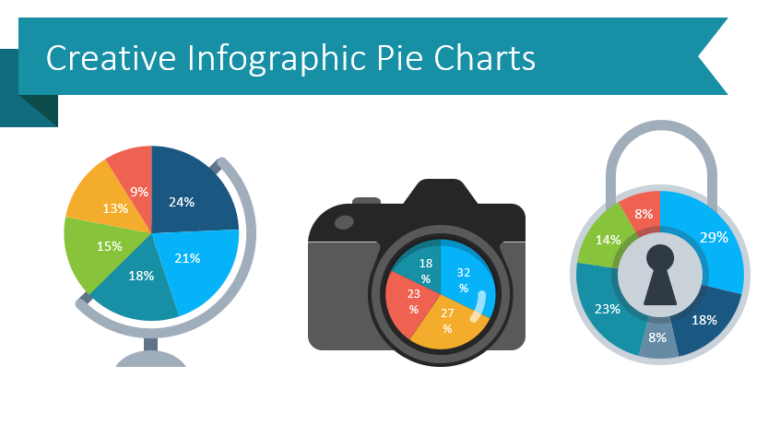
A pie chart is a very popular data visualization used in business presentations.…
If you need to mention the ideas of transparency, understanding, or clear explanation…