How to Effectively Present Country Market Insights in PowerPoint
When you want to present a market analysis of a specific country, using…
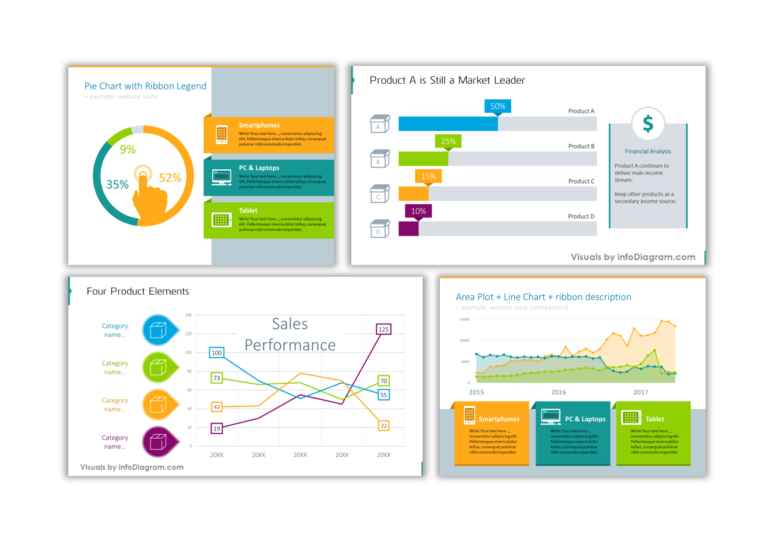
Ideas for illustrating data in PowerPoint. See how data charts can be enriched graphically so they look more attractive and professional, while data is still editable.
Some blogs contain templates with real data (like macroeconomic values e.g. country GDP, population, or unemployment rates – based on recognized data sources). Or we added exemplary data.

When you want to present a market analysis of a specific country, using…

Need to present the status of your inventory or your stock management performance…

Many business presentations are made a day before meetings, if not an hour…

Do you need to present your debtors accounts receivable status and analysis of…

Need to present an operating expenses analysis outcomes? Check out our examples of…

A professional presentation aims to deliver a clear message in every presentation slide. …

As a slide designer, I frequently work on enhancing charts to make them…

When it comes to creating a chart in PowerPoint, knowing what to avoid…

As a professional slide designer, I understand the importance of creating visually appealing…

Do you need to present multiple data charts and KPIs? Don’t know how…