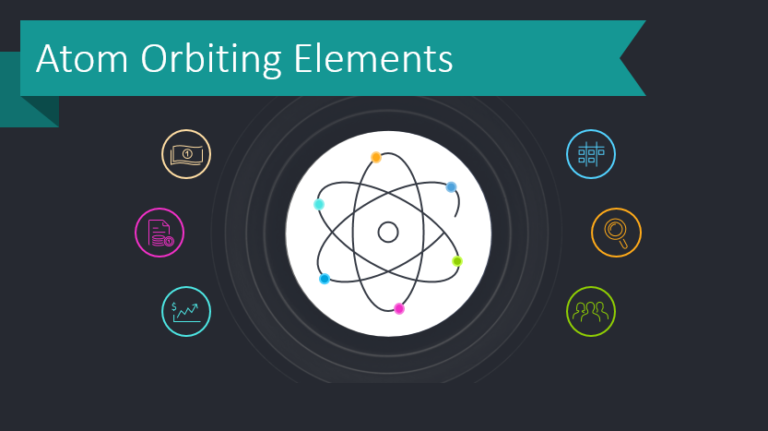
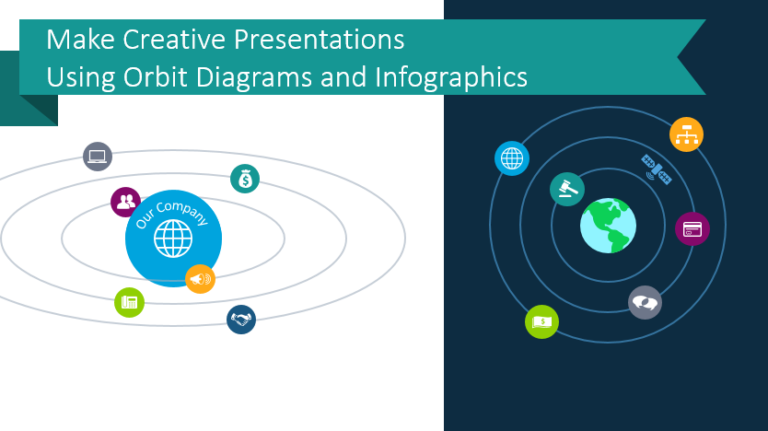
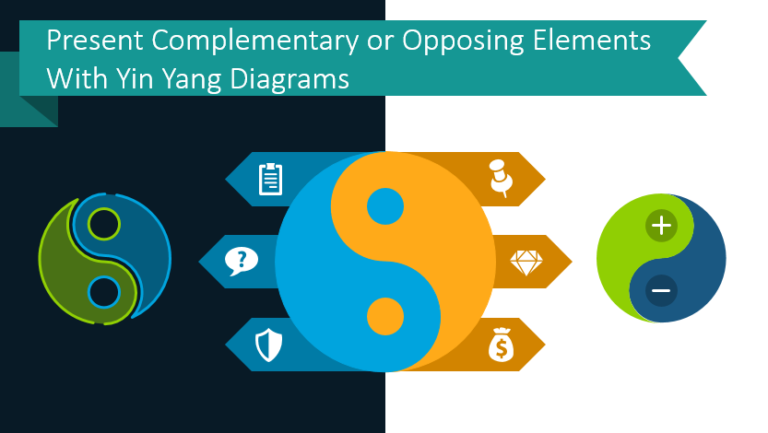
What is a good way to visually express opposition or correlation? Using easily recognizable symbols can work as shorthand to help your audience imagine interdependent relationships. Although your first conscious thought might not be “Of course! Complementary opposite forces!” the symbolism is there. This dualism concept from ancient Chinese philosophy has made its way to the global stage. Since it has, Yin Yang diagrams can help audiences around the world understand abstract concepts and relations.
Continue reading Present Complementary or Opposing Elements With Yin Yang DiagramsCategory: Diagrams & Flowcharts for PowerPoint
Various diagram shapes, flowcharts, universal infographic for PowerPoint.
Present Hierarchical Structures Creatively With Onion Layer Diagram Graphics
Providing visual clarity is essential, even when utilizing creative graphics. You can benefit from artistic flair without sacrificing your audience’s understanding. By using an onion layer diagram you can keep your presentation memorable and easy to follow. Simple visual metaphors can allow you to explain a complete system in a reduced number of slides.
Continue reading Present Hierarchical Structures Creatively With Onion Layer Diagram GraphicsMake Creative Presentations Using Orbit Diagrams and Infographics
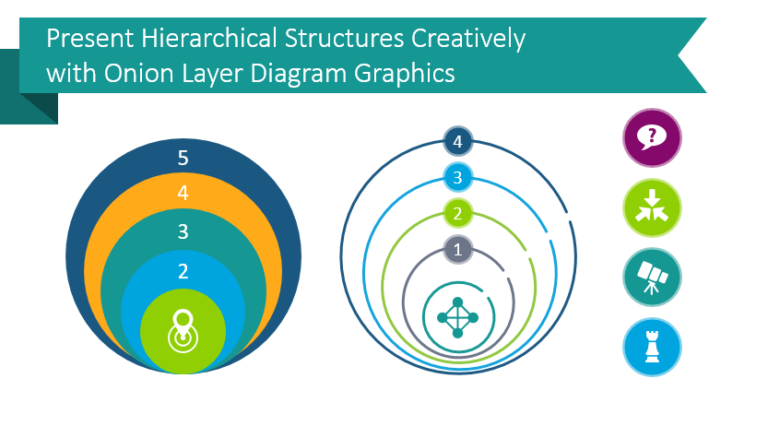
Do you have to present a topic with one central theme or element? If the concept or relationship you are presenting all revolve around one central element, orbit diagrams might be right for you.
Continue reading Make Creative Presentations Using Orbit Diagrams and InfographicsUse Flat Paintbrush Stroke Diagrams to Build Creative PPT Presentations
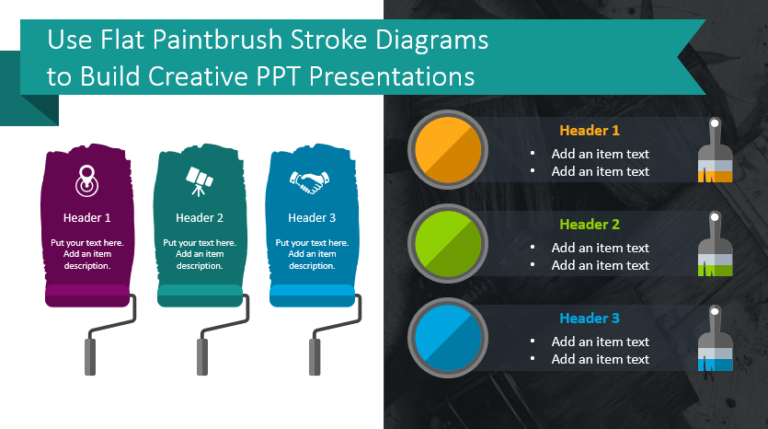
Do you wish you could present the listed information in an interesting way? Even if you are not a designer, nowadays the possibilities are endless. There are many creative ways to replace dense text blocks. We created the paintbrush stroke graphics set to help you give presentations a creative flair.
Continue reading Use Flat Paintbrush Stroke Diagrams to Build Creative PPT PresentationsPresenting Process Flow Clearly with Strong Block Arrow Diagram Graphics
Are you presenting a process that splits into 2 or more elements? Don’t waste time building graphics from standard arrow diagram shapes – they look rough, too much like the default and often don’t show the flow nicely. We know creating a fitting and eye-catching flowchart graphics can be time-consuming. Get inspired by modern, user-friendly flowchart graphics that our team created. Using such visuals will accentuate your message rather than stealing the spotlight.
Continue reading Presenting Process Flow Clearly with Strong Block Arrow Diagram GraphicsCreative Uses for Filter Process Diagrams in PowerPoint
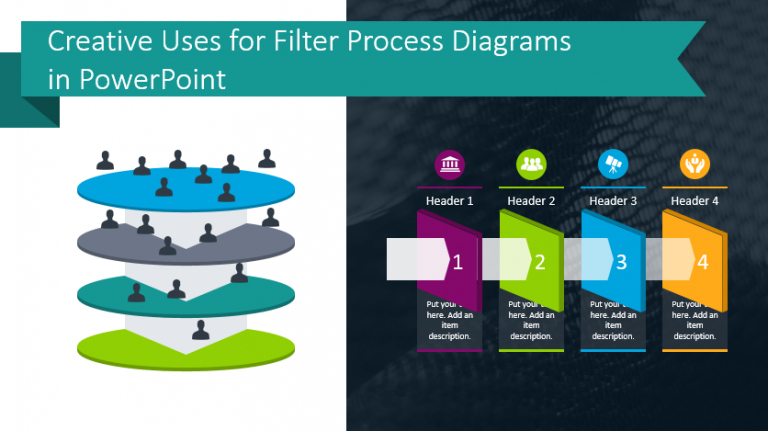
Do you need to present or explain your client selection process or recruitment processes? Filter process diagrams are meant to illustrate the different stages of sales and marketing. They make it easier to present a large amount of information. The structured way information is presented will help your audience understand your message.
Continue reading Creative Uses for Filter Process Diagrams in PowerPoint5 Uses for Creative Light Bulb Graphics
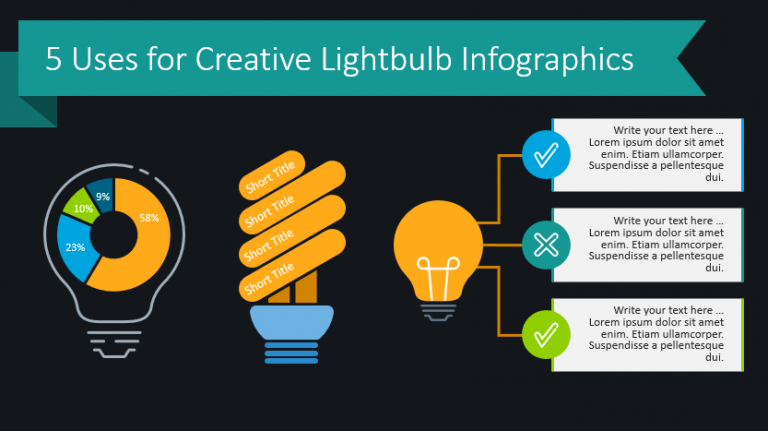
Do you need to express your bright ideas, creativity, or innovations in a presentation? If so, lightbulbs may be an appropriate visual metaphor. What creative idea or concept might your audience benefit from? With light bulb graphics, you can highlight new ideas or make lists with greater impact.
Present Structure Using 3D Cube Diagrams
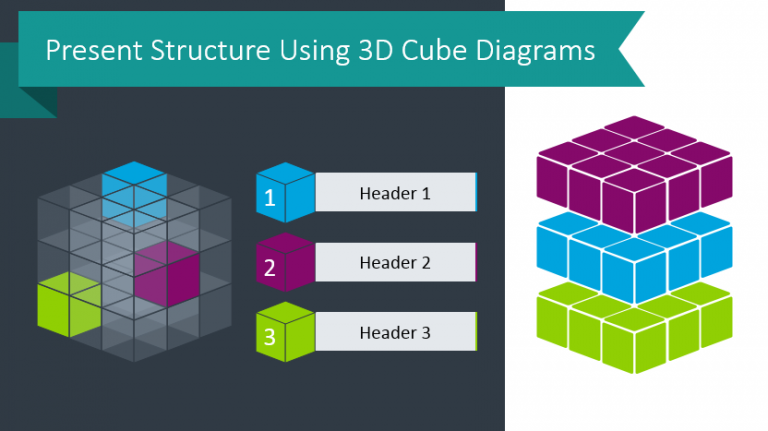
3D cube graphics are useful visuals. They serve as shorthand for complexity but also order and structure. 3D diagrams can be useful when presenting spatial locations or describing multidimensional relationships.
Continue reading Present Structure Using 3D Cube Diagrams5 Ways to Use Pipe Shape Diagrams
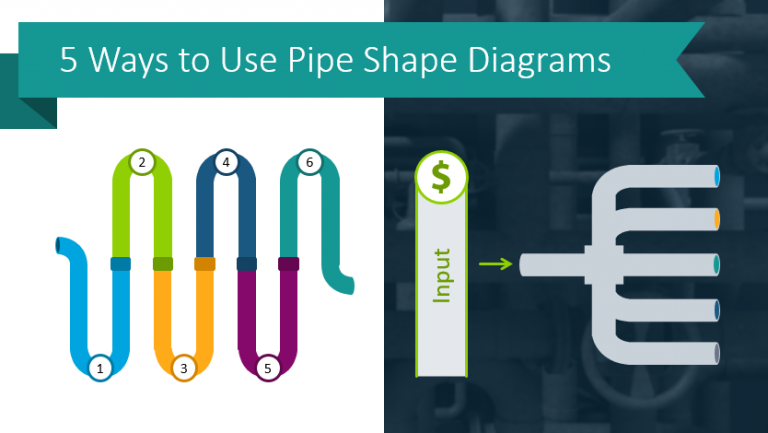
Do you need to explain a process or flow? Pipe flow diagrams can help. They are great for showing a process timeline, merge several inputs, or turn one input into several outputs. With modern, simple illustrations, you can create memorable, easy to follow presentations.
Read mor5 Uses for Key Shape Solution Diagrams
What do you think of when you see a key graphic or illustration? Key shape can be a powerful visual metaphor. For many, keys represent solutions to problems or a way to bypass obstacles.
Continue reading 5 Uses for Key Shape Solution Diagrams