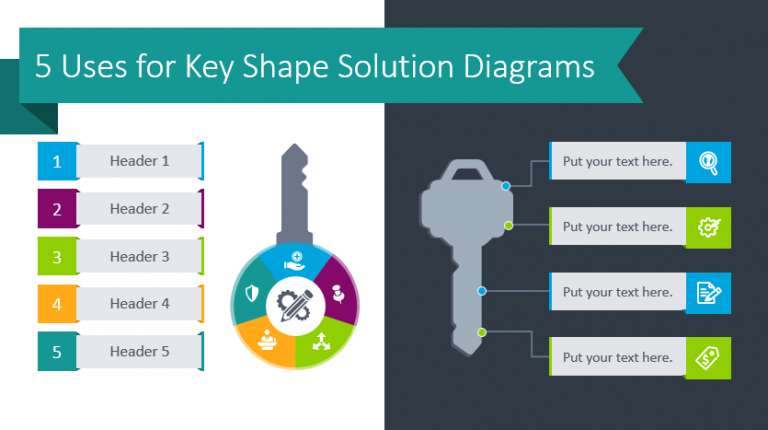
How to Use 3D Brick Graphics in PowerPoint

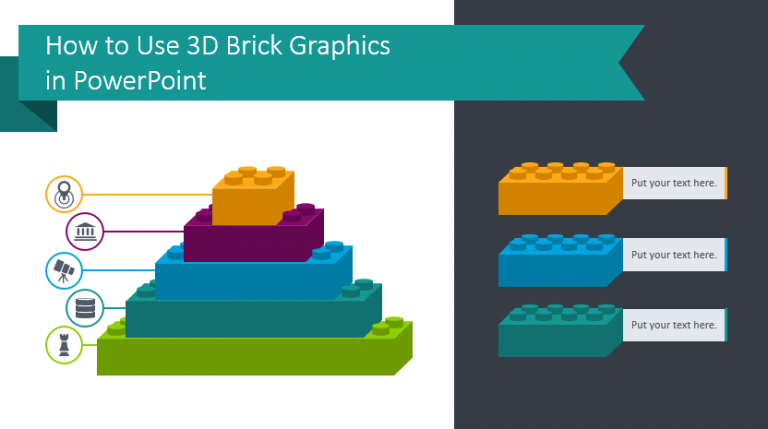
Would you like to have more fun with your presentations? Incorporate plastic building brick graphics. Plastic toy blocks are popular with children and adults who want to add a playful element to their presentations. Would you like to utilize fun and creativity?

Continue reading How to Use 3D Brick Graphics in PowerPoint

Build Creative Mind Map Diagrams in PowerPoint

Mind Maps are visualization methods. Mind map diagrams are designed to help you develop creative ideas. By using a Mind Map instead of a list, table, or basic-looking SmartArt you can create a visually engaging, interesting slide.

Continue reading Build Creative Mind Map Diagrams in PowerPoint

Create Effective PPT Presentations with Modern Shutter and Circle Graphics

Are you sick of using lists in presentations? Do you wish you had a metaphor to use when describing synergy or completeness? Consider using shutter and circle graphics or segmented wheel charts.

Continue reading Create Effective PPT Presentations with Modern Shutter and Circle Graphics

5 Ways to Use Spring and Spiral Diagram in PowerPoint

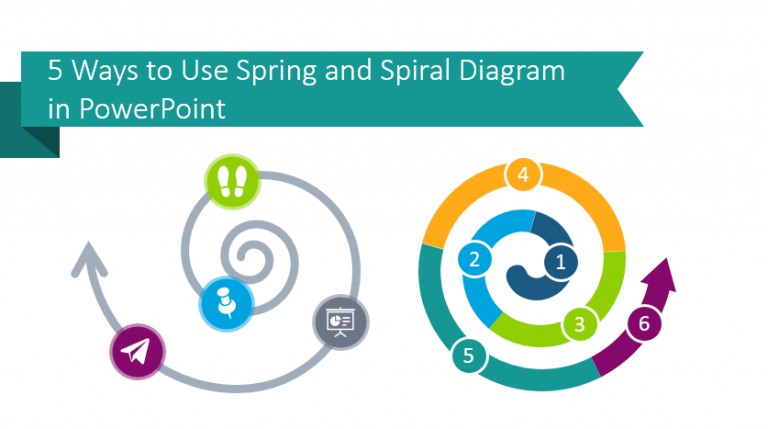
Do you need to present development processes? Are you explaining or sharing growth? You can easily help your audience understand your timeline with visual flow charts.

Continue reading 5 Ways to Use Spring and Spiral Diagram in PowerPoint

Ways to Use Multi-Layer Diagrams in PowerPoint Presentations

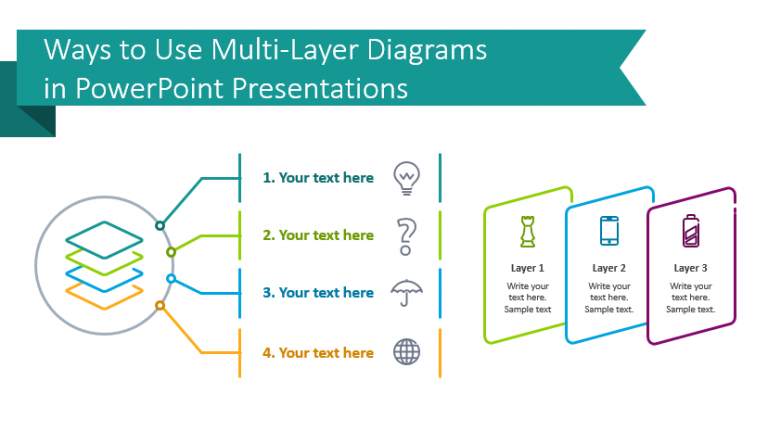
Multi-layer diagrams and flow charts are great for presenting many hierarchies and processes. Visual aids like these can easily be customized for your needs as they are highly versatile.

Continue reading Ways to Use Multi-Layer Diagrams in PowerPoint Presentations

How to Make Fishbone Ishikawa Diagram in PowerPoint

Why would you make Fishbone Diagrams in PowerPoint? Fishbone diagrams are useful tools for visualizing cause and effect. They are popular when you’re conducting a root cause analysis, in particular.

Continue reading How to Make Fishbone Ishikawa Diagram in PowerPoint

Make Stylized Closed Cycle Process Diagrams in PowerPoint

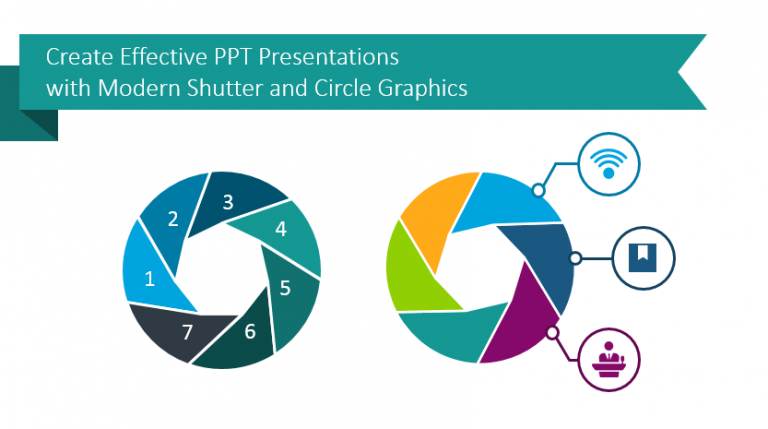
When should you use a closed-cycle diagram? When you need to show a repeating process. Why should you create stylized closed cycle diagrams rather than use default, simple, SmartArt diagrams? All imagery is not created equally. If you want to have an interesting, visually striking presentation then you’ll have to create or modify your own diagrams.

Continue reading Make Stylized Closed Cycle Process Diagrams in PowerPoint

Where to Use Tiers and Layers Graphics in a Presentation

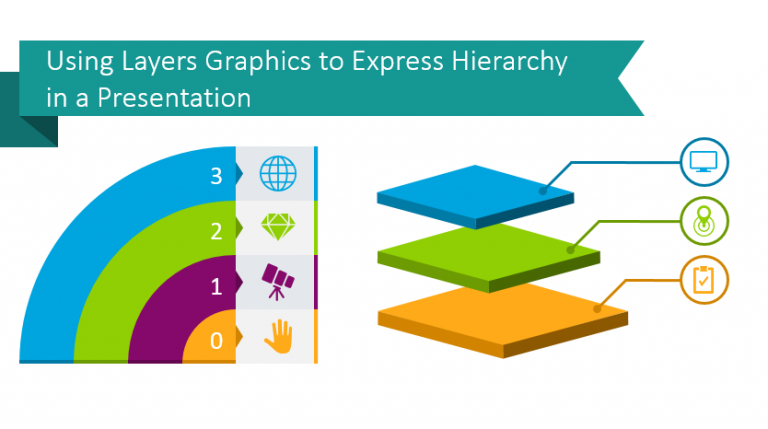
Do you need to explain or spell out a process advancement, hierarchy, complexity change, or development cycle? Illustrations can help you keep your audience focused and ensure they understand what you’re trying to break down. Processes or technological components with multiple layers graphics are easier to understand when laid out visually.

Continue reading Where to Use Tiers and Layers Graphics in a Presentation

Explain Timelines with Plane & Journey Visual Analogy

Present product launch schedules, project development phases, or any other timeline using creative visual metaphors. Airplane flight trajectory graphics are colorful and attractive so you can explain a project or process from the start, through the development, until the end.

Continue reading Explain Timelines with Plane & Journey Visual Analogy