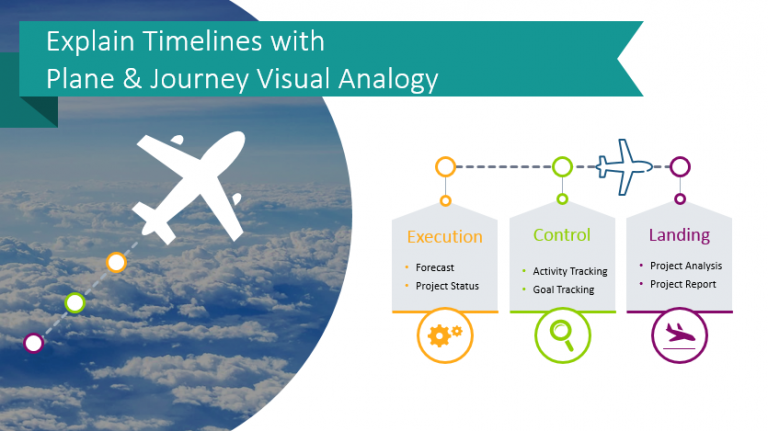
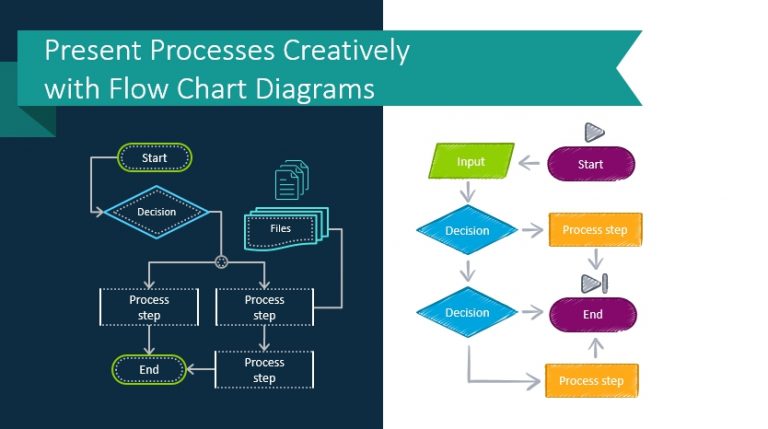
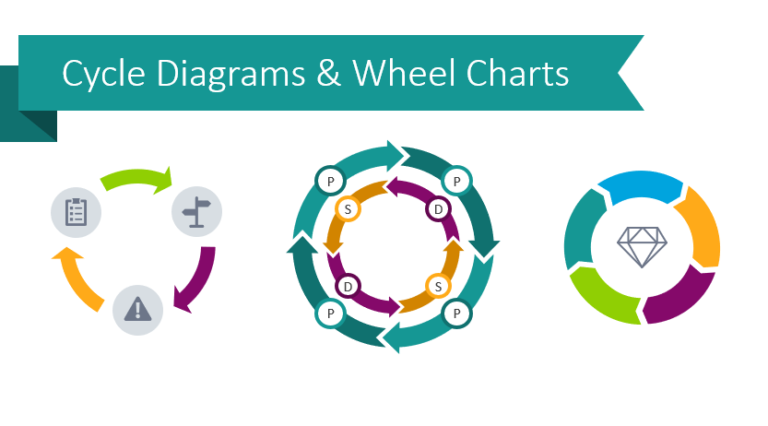
Presenting processes and algorithms is tough. Getting your audience to understand your message and be interested in what you have to say is only part of the struggle. By utilizing creative icons and graphics you can take some of the pressure off. By adding editable flow chart diagrams you can explain how particular informatics algorithms work, how decision processes should function, visualize your ordering process, show the journey of your website visitors, or highlight the flow of any business or document processes you need to explain.
Continue reading Present Processes Creatively with Flow Chart DiagramsCategory: Diagrams & Flowcharts for PowerPoint
Various diagram shapes, flowcharts, universal infographic for PowerPoint.
4 Ways to Use DNA Helix Diagram in PowerPoint
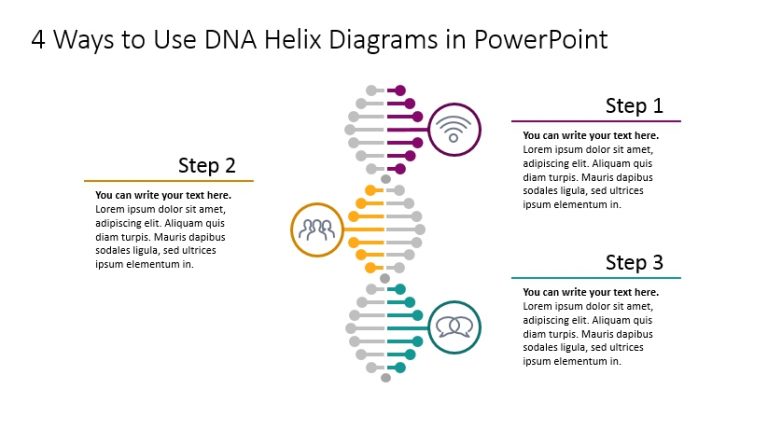
Have a presentation about organizational culture or values? Or looking for a way to show a yearly or a monthly timeline creatively? Consider using a DNA helix diagram.
Continue reading 4 Ways to Use DNA Helix Diagram in PowerPointHow to Show Comparison with Pros and Cons PowerPoint Diagrams
Do you need to add a slide with advantages and disadvantages in comparison to your presentation? In this blog, we offer visual examples of how to illustrate the pros and cons of a business process, product, strategy, or decision using visual aids.
Continue reading How to Show Comparison with Pros and Cons PowerPoint DiagramsMaking Creative Mind Map Presentations
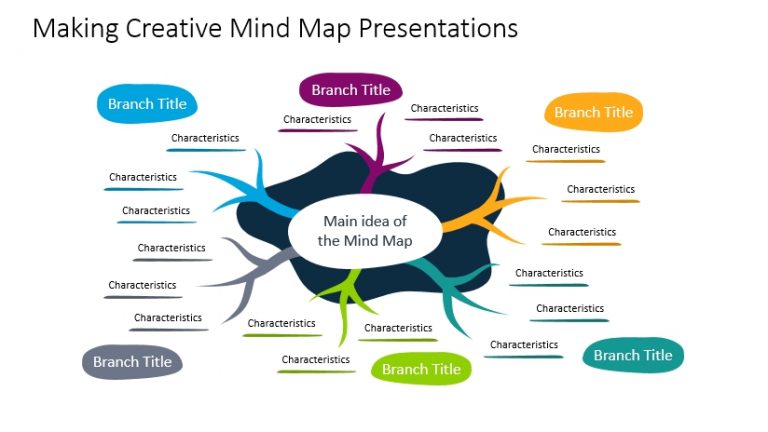
Developing and sharing ideas, complex ones can be difficult. When presenting it to other people you should take care that the idea will be understood clearly, as well to ensure it will be engaging. Using the mind map method helps to solve both of those issues.
Continue reading Making Creative Mind Map PresentationsPresent Processes with Chevron Graphics
You can use chevron timeline diagrams to present your progress on a project or illustrate the steps of a list. Really, Chevron graphics can be used to represent any linear process. In recent years, Chevron has proven to be a modern and trendy design choice which will help your presentations resonate with your audience.
How to Visualize a Process Using Gears Graphics in PowerPoint
Do you want to present a process flow on a slide in a creative visual way? We collected a few slide design ideas with gears graphics, that you can use to show a flow of interlinked stages.
Continue reading How to Visualize a Process Using Gears Graphics in PowerPoint
6 Modern Ways to Present a Cycle Process in PowerPoint
If you are looking for a creative way to show a repeating process then you’ve come to the right place. Below we’re presenting a few modern ways of cycle diagram design you can easily create in PowerPoint.
Continue reading 6 Modern Ways to Present a Cycle Process in PowerPointHow to Create Roadmap Slides for Planning Presentation [PPT guide]
A roadmap is a great tool for graphical representation of short- and long-term plans and strategies. You can show all the steps in details or create a general roadmap which will show the way from the present situation to your future goals.
In this blog, I’ll walk you through a step-by-step guide on how to create a visual roadmap slide in PowerPoint quickly.
Continue reading How to Create Roadmap Slides for Planning Presentation [PPT guide]
Design Ideas for Venn Diagram Illustrating Intersections in PowerPoint
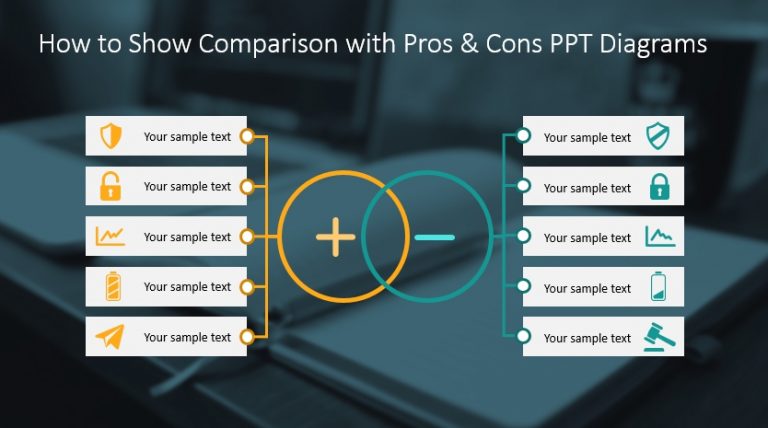
Do you want to add an eye-catching intersection visual to your presentation? In this blog, we share a few inspirational ideas for creating a Venn diagram to express common or overlapping concepts visually in PowerPoint.
Continue reading Design Ideas for Venn Diagram Illustrating Intersections in PowerPoint
6 ideas of Using Iceberg Model Diagrams in a Presentation
Does your presentation contain the idea of hidden versus visible? Consider using an analogy of an iceberg image. This blog illustrates where and how you can use the iceberg model diagrams. Make your presentation easier to remember by explaining the visually invisible roots of various problems.
Continue reading 6 ideas of Using Iceberg Model Diagrams in a Presentation