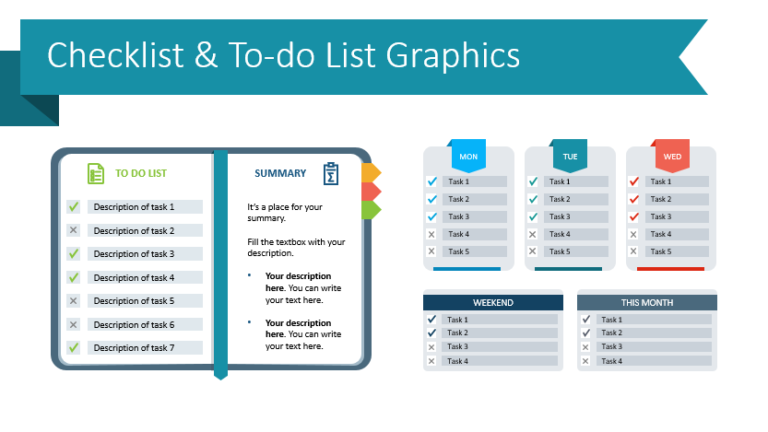
Use To-Do Checklist Graphics For Original Presentations
How do you present projects to your team? Do you share your personal…
Various diagram shapes, flowcharts, universal infographic for PowerPoint.
How do you present projects to your team? Do you share your personal…
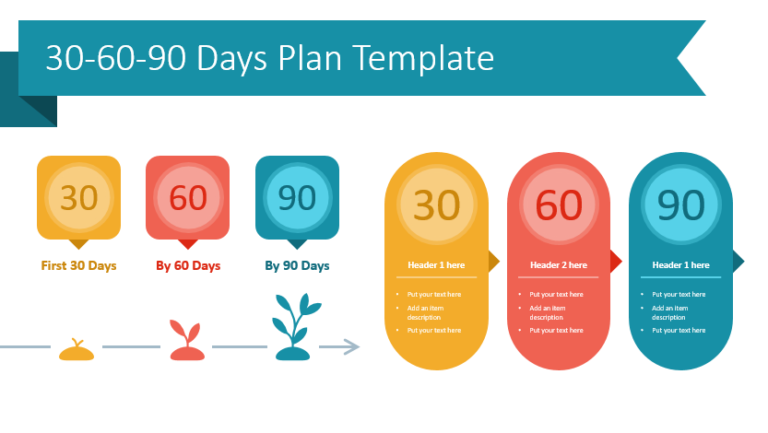
Are you interviewing for a management position or do you need to present…
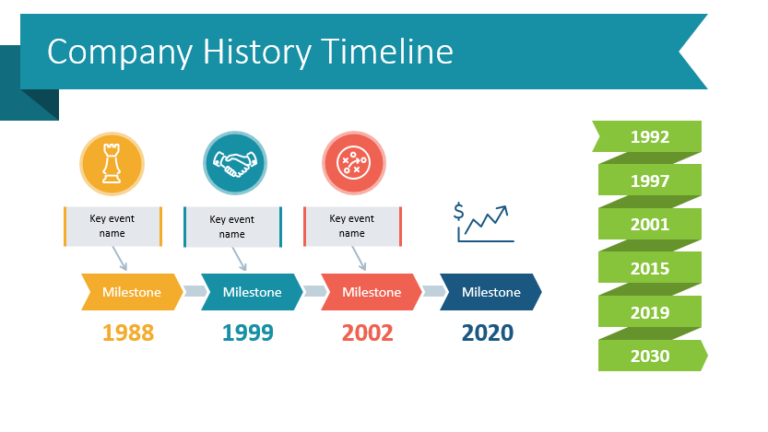
How do you present your company history? If your organization has an established…
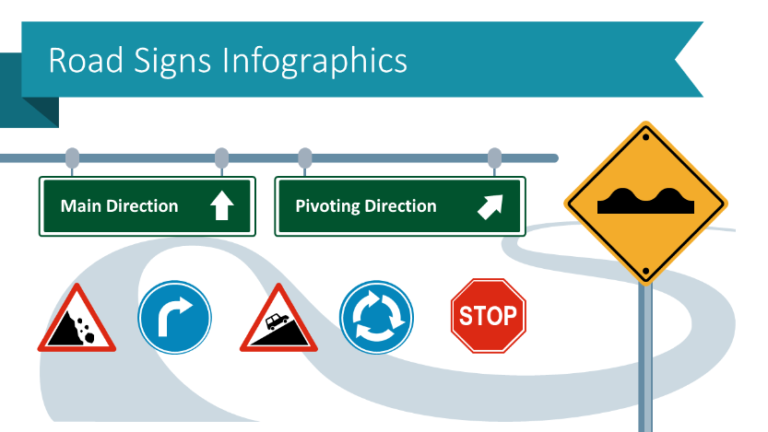
Are you presenting work rules, creating a strategy road map or describing project…
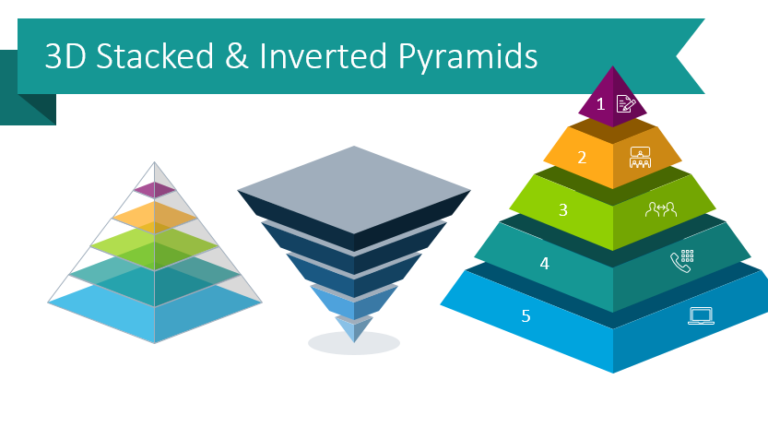
When you are presenting a hierarchy or structure, how do you organize information?…
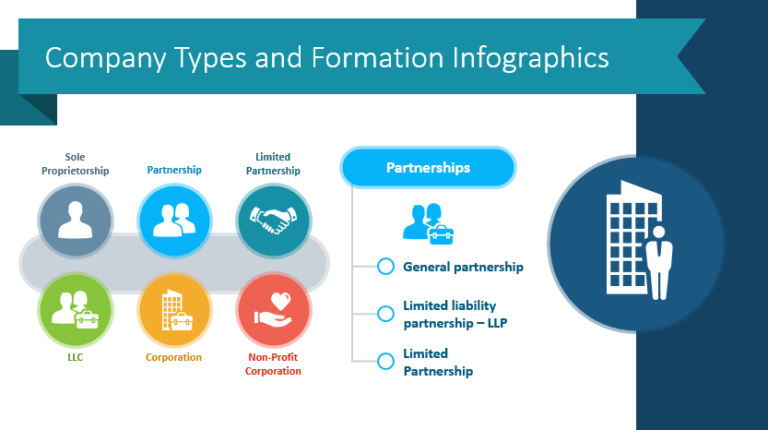
Do you need to present company types? There are many situations that might…
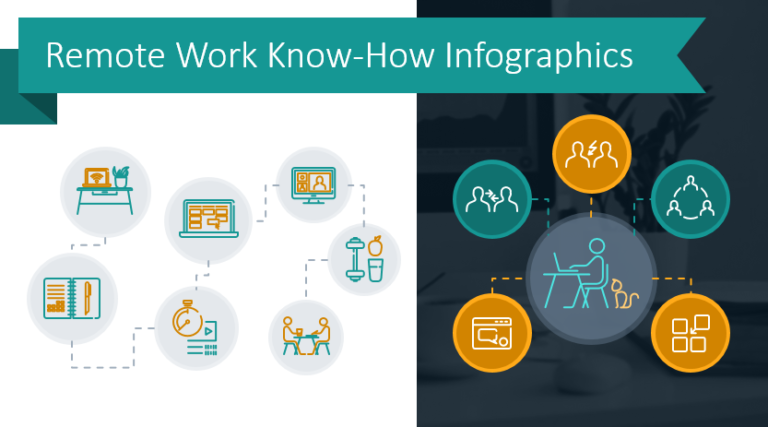
Are you working remotely? Many of us are now. If you or your…
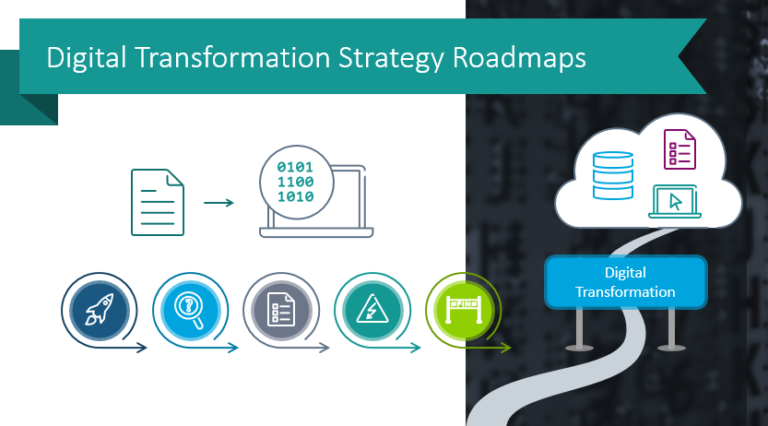
Are you about to present digital transformation topics? It can be a struggle…
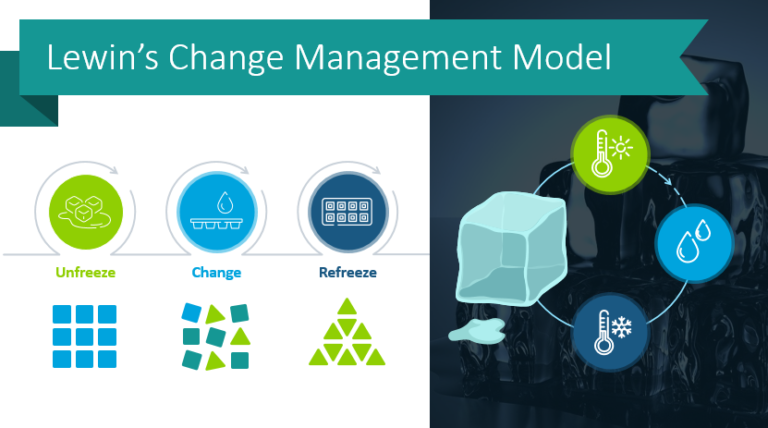
Do you have trouble presenting organizational changes? Sometimes the reason a business change…
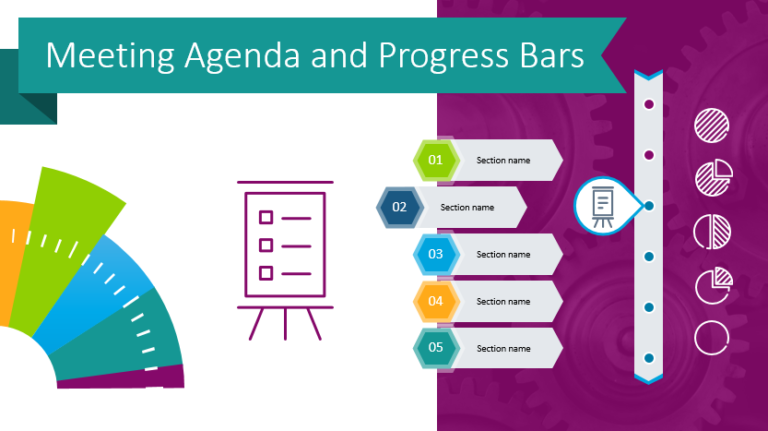
Do you have a busy schedule? Think about your work calendar from the…