
How to Use Storytelling in Business Presentations
Stories beat slides. Learn how senior managers, consultants, and finance leaders use business storytelling techniques to make board presentations land — with PPT examples.
By Peter, infoDiagram Co-founder & Visual Communication Expert · 15+ years helping consultants and corporate teams craft business presentations. Updated April 2026
Are you about to prepare important presentation? You have done all preparation – you have solid data, you did proper analysis and have recommendation ready. And yet, fifteen minutes into the quarterly review, you can see the COO’s eyes drift to her phone. The problem isn’t the content – it’s that you’re presenting facts in the order you discovered them, not in the order an audience can absorb them. That’s what storytelling fixes. Below are the techniques senior consultants and corporate communicators use to turn dense business presentations into interesting narratives.
TL;DR summary: How to use storytelling in business presentations: (1) Start with the “why” before the data — open with a question, a customer story, or a thought-provoking statement. (2) Structure the talk as a narrative arc: situation -> complication -> resolution, not just bullet points. (3) Use visuals — diagrams, photos, icons to anchor each beat of the story. (4) Replace dry statistics with the people behind them: one customer or one specific moment. The result: an audience that remembers the message, not just the slide.
The 3-act structure for business presentations
Every great business presentation follows the same underlying shape, whether it’s a 5-minute board update or a 60-minute strategy review:
- Act 1: The Situation. Where are we today? Anchor the audience in a shared, factual reality. This is the only part of the deck where dense data belongs. It earns the right to your recommendation.
- Act 2: The Complication. What changed, what’s at risk, or what opportunity opened up? This is the inflection point. Without it, the audience has no reason to care about Act 3.
- Act 3: The Resolution. What do you recommend, and what happens if we act vs. don’t act? Close with a specific ask, not a summary of what you just said.
Consultants call this the SCQA structure (Situation, Complication, Question, Answer) — popularized by Barbara Minto’s Pyramid Principle. Investors recognize it as the problem-solution-traction arc. Hollywood calls it setup-confrontation-resolution. The names may differ but the shape is universal.
Stories make the best presentations
The biggest mistake you can make is to share straight facts and figures without answering the big “why” questions, so your audience can relate to your talk. (See it here: “Start with Why” talk of Simon Sinek ).
A good idea is to start the presentation with a statement or thought-provoking question. Below you can see an example of a slide you can use for the opening.

Swedish professor Hans Rosling gave an invigorating TED talk about the so-called “developing world”. Watch the way he expertly transforms what could have been a dull, statistic-heavy presentation into an engaging story. Note the way he begins by sharing a story based on his own experience.
How to tell stories with help of slides
Clear and appropriate images and graphics can help you tell stories, and support the thoughts and ideas you want to communicate. You can literally illustrate your points with diagrams, charts, and tables.

You can use photos of locations or symbols to represent places and serve as reference points to help your audience follow along.
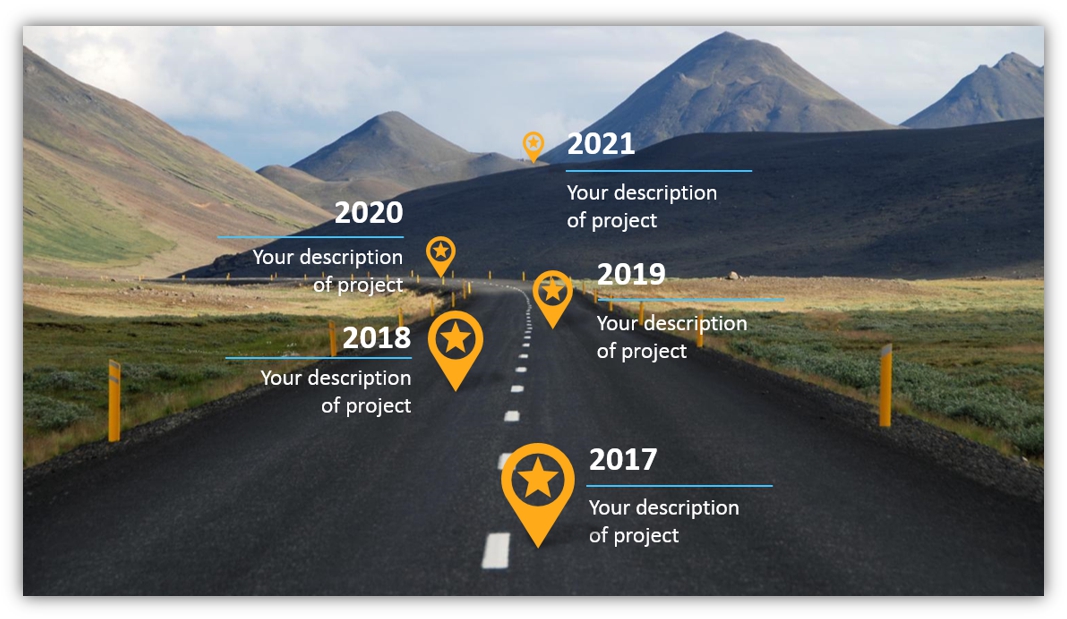
Imagery can make parts of your presentation more memorable.
Anecdotes and personal stories are also effective ways to improve presentations. They help to make the content more relatable and engaging. Examples from real life can be incredibly effective. Just compare:
- Would you rather hear that customer churn rose 3.4% last quarter, or hear about Sarah, the procurement lead at a key account, who switched suppliers after her third unanswered support ticket?
- Would you rather hear about statistics on heart attacks and strokes, or hear patient stories and first-hand experiences?
- Or would you rather listen to a boring bullet-point list of company milestones or to a story of a founder’s journey from a garage idea to a flourishing enterprise (definitely read Steve Jobs biography by Walter Isaacson)?
Present data through some personal story – it can be a client, your own discovery experience or anecdote from a biography of famous person.
Once you have idea of story, support it with related visual, use illustrations to show the context, see example slides below for inspiration.


How to visualize a quote? See our another article about designing a quote slides in PowerPoint.
You can present your project or company vision using photograph with a person and start telling “imagine you are standing there, looking at the mountain and thinking…”.

Are you presenting numerical data? Here is another article where I share tips to make data charts more engaging.
If you have a set of bullet-points, see how I suggest to replace them with some visual alternatives.
Resources of images for supporting your storytelling presentation
Here are a few slide graphics resources you can use to enhance the storytelling effect of your presentation:
- The Creative Hand-drawn Company Presentation Templateutilizes a scribble style. It offers ways to share more detailed market analyses and statistics. The diagrams, charts, and tables are all consistent and help tie your presentation together.
- Visuals for financial performance PPT reports
- The Flat Visual Company Presentation Deck Template slide deck is a clean, modern take on business presentations. Rather than being a collection of graphics to include in your presentation, it offers templates for the entire presentation.
- The Roadmap design templates for project strategy planning are great for storytelling involving timelines, approaching a goal, or making progress. (You can see more examples of these in action in this blog).
- If you’d like to embed personal stories or anecdotes, the Quotes PPT slide set might be the best option for you. There are modern-looking graphics, hand-drawn graphics, boxes, bubbles, and more.
- The emotions and feelings PowerPoint icons can be useful when discussing interpersonal relations within your organization, sharing stories of customer scenarios or feedback, or any number of topics.
We have also a set of posts about successful presenting methods that might help you construct your own narratives for better presentations.
- for finance professionals: how to make a compelling investor presentation .
- for running an online presentation: webinar-themed presentation blog with 14 ways to make your presentations more effective and may provide you with more ideas.
Still need help? Check out these books on storytelling
If you feel like you’re struggling with ways to turn your presentations into a story, or are concerned that your story isn’t sufficiently interesting or engaging, consider reading these great books on storytelling.
- ” Made to Stick“: Why Some Ideas Survive and Others Die by Chip and Dan Heath seeks to break down what makes an idea or concept memorable. They break down their principles with plenty of case studies and examples. They vary their examples using everything from urban legends to business stories. Not only do they provide sound arguments, but the whole book serves as a masterclass in storytelling as an educational tool.
- “Resonate“: Present Visual Stories that Transform Audiences by Nancy Duarte reveals the underlying story form of all great presentations. Effective presentations not only entertain, but they create an impact that will move people to action. Duarte shares proven methods for ensuring your presentations will do just that.
- “The Pyramid Principle” by Barbara Minto
- “The best stats you’ve ever seen“ not a book but a TED talk by Hans Rosling – Swedish professor, who transforms what could have been a statistic-heavy presentation into an engaging story. For me it’s the best storytelling presentation example to learn from art of presenting data live:
FAQ on business storytelling
Questions I hear often – from my training participants or in various discussions around presentations:
What is business storytelling in presentations?
Business storytelling is the practice of organizing facts, data, and recommendations into a narrative arc ( situation, complication, resolution) instead of presenting them as a flat list of bullet points. It works because the human brain encodes stories far more reliably than isolated data points: studies show audiences recall narrative-structured content roughly 20 times better than statistics alone. In a business context, it’s not about being entertaining, it’s about making your message land and stay landed.
How do I use storytelling when presenting data?
Anchor every chart in a specific person, or decision moment, not just a number. Instead of “Customer churn rose 4.2% in Q3,” lead with “Sarah, the procurement lead at one of our top-five accounts, switched suppliers in August after her third unanswered support ticket, and she wasn’t alone.” The chart then becomes evidence for the story, not the story itself. The data is identical, but the recall and the persuasive impact are not.
What’s the best structure for a business presentation story?
The most widely-used structure in corporate and consulting settings is SCQA:
- Situation (where we are)
- Complication (what changed or what’s at risk)
- Question (what should we do about it)
- Answer (your recommendation).
Barbara Minto formalized it in The Pyramid Principle and it’s now standard at McKinsey, BCG, and most strategy teams. For shorter updates, a simpler three-act version: “Situation, Complication, Resolution” works just as well.
How long should the “story” part of a business presentation be?
Keep the narrative framing tight: the situation and complication together should take no more than 20–25% of your total time. For a 30-minute presentation, that’s roughly 6–8 minutes to set the stage before you reach your recommendation. Longer than that and the audience starts wondering when you’ll get to the point; shorter and they haven’t yet bought into why the point matters.
Can I use storytelling in a formal corporate presentation?
Yes and increasingly in this AI era, you have to. The mistake is assuming storytelling means anecdotes and personal asides. In a board or executive setting, it means using narrative structure (SCQA, problem-solution-traction, before-after-bridge…) to organize otherwise dry content. The CFO doesn’t want a fairy tale. He wants the chain of reasoning from current state to recommendation laid out in an order her brain can absorb. That’s what storytelling delivers.
How is data storytelling different from regular data visualization?
Data visualization shows what the numbers are; data storytelling explains what the numbers mean and why the audience should care. A well-designed chart on its own is descriptive, it answers “What.” Data storytelling adds the missing two questions: “So what?” (the implication) and “now what?” (the recommended action). The same bar chart, presented with vs. without a storytelling frame, will produce dramatically different audience decisions.
What are the most common storytelling mistakes in business presentations?
Examples of the most common mistakes include:
- opening with the agenda slide instead of the hook
- burying the recommendation at the end instead of stating it upfront and supporting it
- using personal anecdotes that don’t connect to the business point
- confusing storytelling with “being entertaining”, board audiences don’t want jokes, they want clarity
- telling a story so long that the audience forgets what the actual ask was
The remedy for all five is to ask yourself before every slide: what does the audience need to think, feel, or decide after seeing this? And to practice public speaking. For that I recommend checking Toastmasters club in your area – this is a volunteering organization that runs excellent program for learning speaking skills.
Bringing it all together
Great business presentations aren’t built on better animations or more slides, They’re built on a clear narrative structure. The situation your audience is in. The complication that demands a decision. The resolution you’re recommending. Everything else e.g. the charts, the icons, the photos, the bullet points, should be supporting it.
Start small. On your next deck, before you open PowerPoint, write down three sentences: where we are, what changed, what I recommend. If you can’t fit those three sentences on a single sticky note, the story isn’t sharp enough yet.
And when it’s time to actually build those slides, you don’t have to start from a blank canvas. infoDiagram’s business visual slide library is designed for exactly this moment, whether you need a roadmap, quote slide, opening slides for the hook or diagram for the supporting. Every template is fully editable in PowerPoint, designed by us, working consultants, and built to fit into a corporate decks.