
Last Updated on March 6, 2024 by Peter Z
A structure diagram is a powerful tool for visually representing relationships and connections between different elements. Whether you’re designing a software system, presenting organizational hierarchy, or planning a project, structure diagrams can help communicate complex ideas clearly and concisely.
In this blog, we’ll discuss the types of structure diagrams, and their use cases, and explore how to enhance them with visual elements.
Think about the purpose of your structure diagram
Before diving into creating a structure diagram, it’s important to understand its purpose and areas where it can be used. A structure diagram visually represents the relationships and connections between different elements or components of a system or concept. It helps to organize and clarify complex information, making it easier to understand and communicate.
By using a structure diagram, you can effectively illustrate how different parts of a system or concept interact and depend on each other. This can be particularly useful in fields such as software development, project management, and information organization, where clear communication and understanding of relationships are crucial.
Determine the type of structure diagram to use
Several types of structure diagrams can be used depending on the specific purpose and context. Some common types include hierarchical, Venn, tree, cycle, network, matrix diagrams, flowcharts, and Gantt charts.
If you like any of the slide examples below, click on the specific image to see the source deck.
Hierarchical structure diagrams
The hierarchical diagram or organizational chart is used to show a hierarchical relationship between different elements, with one element being the parent and the others being its children or sub-elements. This type of diagram is often used to represent organizational structures.

If you want to illustrate such a structure with an icon, check how to illustrate the abstract concepts of structure or organization.
Below you can see another atypical example of an org chart – organized in an onion diagram. It expresses levels in more general way and underlines internal and external aspect of an organization.

See more use cases for such onion layer diagrams.
Venn diagrams for overlapping structures
A Venn diagram is used to show overlapping relationships between sets or groups. It consists of overlapping circles or shapes that represent different categories and the intersections show the common elements.
You can create such a diagram yourself by using a set of standard PowerPoint shapes – circles and adjusting their fill and contour colors. Here’s an example of a simple Venn diagram:
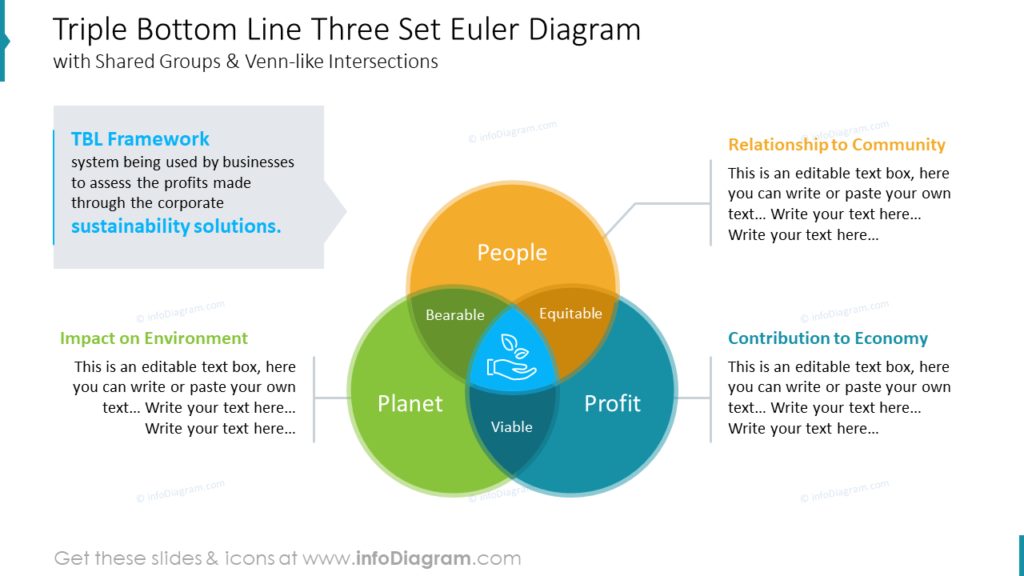
Explore new examples of Venn and intersection diagrams here.
Tree diagram for top-down branching structure
A tree diagram is a top-down hierarchical structure that shows relationships and subdivisions. It starts with a central node or concept and branches into subcategories or related elements.

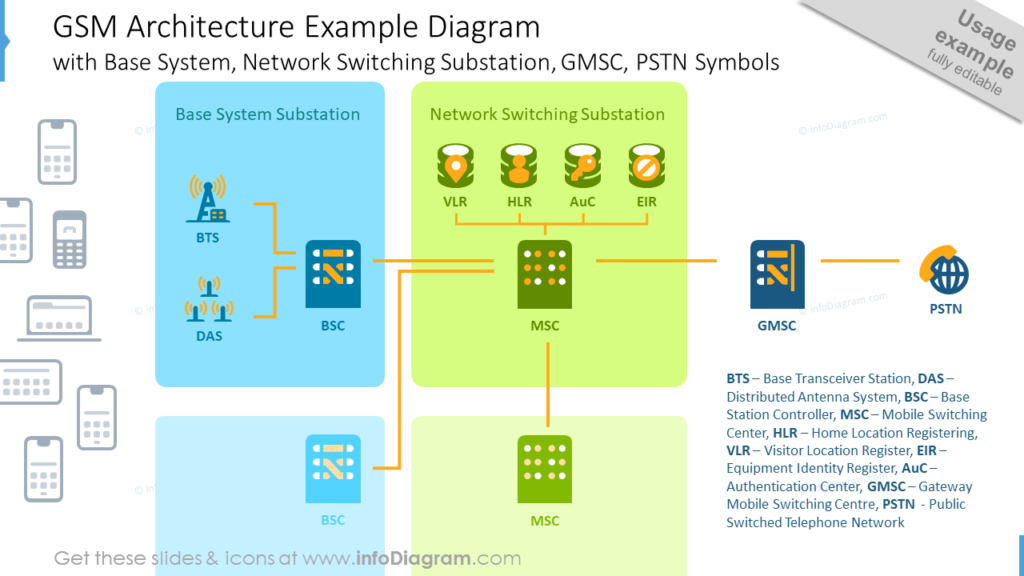
Network technical structure diagram
A network diagram is used to show the relationships and connections between different elements in a network. It’s often used in IT and engineering technical presentations. This can be useful for illustrating communication flows, dependencies, or interactions between different components of a system.
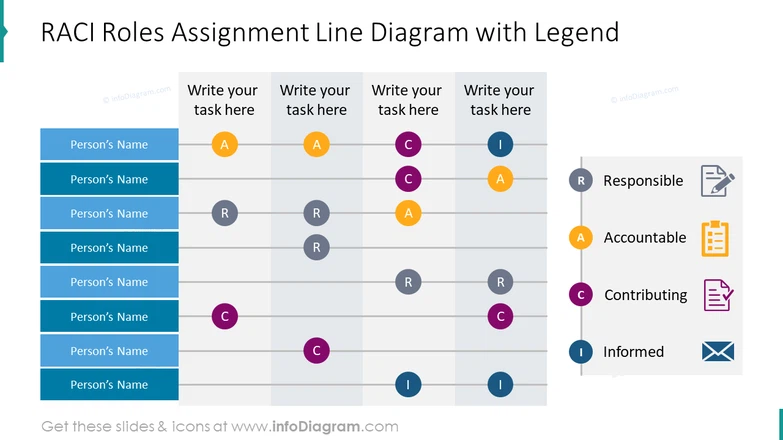
Matrix structure diagram
A matrix diagram is used to show the relationships between two or more sets of elements. This type of diagram is often used to analyze and visualize complex relationships, such as in decision-making processes or data analysis.
Below you can see an example of RACI roles assignment structure using matrix-like layout. It’s easy to adjust – requires only moving the circle shapes.
Other diagrams you can use to illustrate the structure
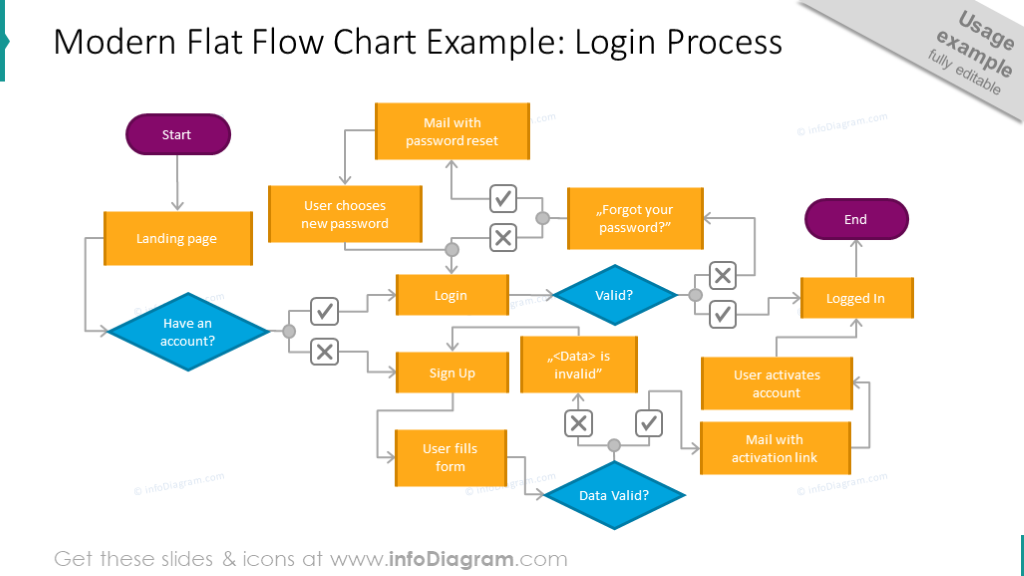
Flowchart expressing structural information
A flowchart visually represents a process, system, or algorithm. So it’s not primarily a structure diagram, but it can express a structure along with process information
It can be created using different shapes and arrows to show the sequence of steps and decision points. It helps in illustrating the flow of information or activities.
Cycle diagram expressing a certain structure information
A cycle diagram shows a recurring process or a circular flow of information, steps, or events. It helps in visualizing the continuous loop or feedback between different stages.
Similar to a flowchart it’s not a plain structure diagram but can express also structure information. Like on the example below, where we show that there are two interrelated loops, second one depending on the first one
When determining the type of structure diagram to use, consider the specific relationships and connections you want to illustrate, as well as the overall purpose of the diagram. Choose the type that best suits your needs and will effectively convey the desired information.
Identify the relationships you want to illustrate
Before creating a structure diagram, it’s important to identify the relationships you want to illustrate. This could include relationships between different elements, such as hierarchy, sequence, or dependency. By clearly defining the relationships you want to represent, you can ensure that your diagram accurately communicates the intended message.
For example, if you are creating a structure diagram for a project management process, you may want to illustrate the relationship between different tasks and their dependencies. This could involve showing which tasks need to be completed before others can begin, or which tasks can be done concurrently.
Choose the appropriate symbols and connectors
When creating a structure diagram, it’s important to choose the appropriate symbols and connectors to accurately represent the relationships. Icons can vary depending on the type of diagram being created. Common symbols include rectangles for elements, lines for connections, and arrows to indicate the direction of the relationship.
Connectors are used to visually link elements together and show their relationship. Different types of connectors can be used, such as straight lines, curved lines, or dotted lines, depending on the desired visual effect.
It’s important to use consistent symbols and connectors throughout the diagram to ensure clarity and understanding. Avoid using too many different elements, as this can make the diagram confusing and difficult to interpret.
Consider the audience of the diagram and choose symbols and connectors that are familiar and easily understood by them. If necessary, provide a legend or key to explain the meaning of the symbols and connectors used in the diagram.
By choosing the appropriate symbols and connectors, you can create a structure diagram that effectively illustrates relationships and enhances understanding for your audience.
Guide on creating a structure diagram in PowerPoint
In this movie, our chief designer shares his slide design methods of extracting and drawing structure diagrams. He explains the slide transformation process on the example of a complex Data Science system implementation structure and shows a few tips on how to make such a diagram look more appealing.
Follow our YouTube channel if you want to see more of such guides, and subscribe to our newsletter to get more design tips and slide inspiration.