How to Create a Memorable Supply Chain Process Presentation Using PPT Visuals
There are situations in reporting supply chain topics when you may want to…
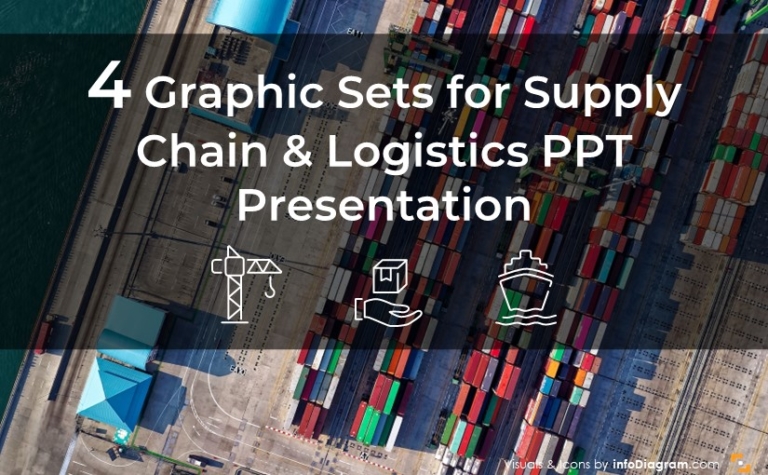
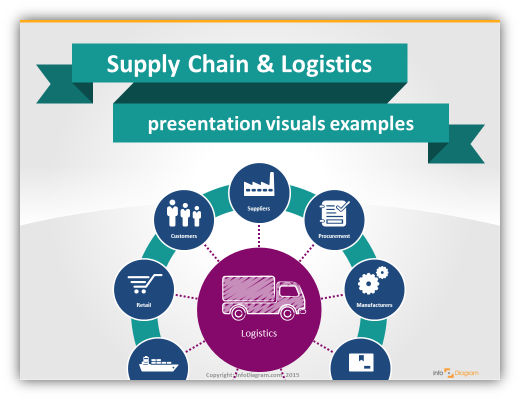
Presentation ideas for logistics, SCM, and general supply chain operations. Visualize global or local delivery journeys, transport maps using PowerPoint graphical resources and ideas.
There are situations in reporting supply chain topics when you may want to…
Managing supply chain operations, trying to choose the right supplier, or having to…
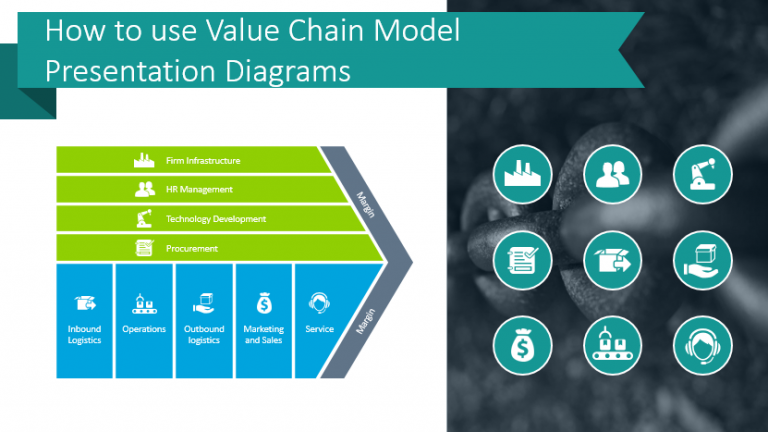
Do you need to explain the value chain model? If you’re conducting business…
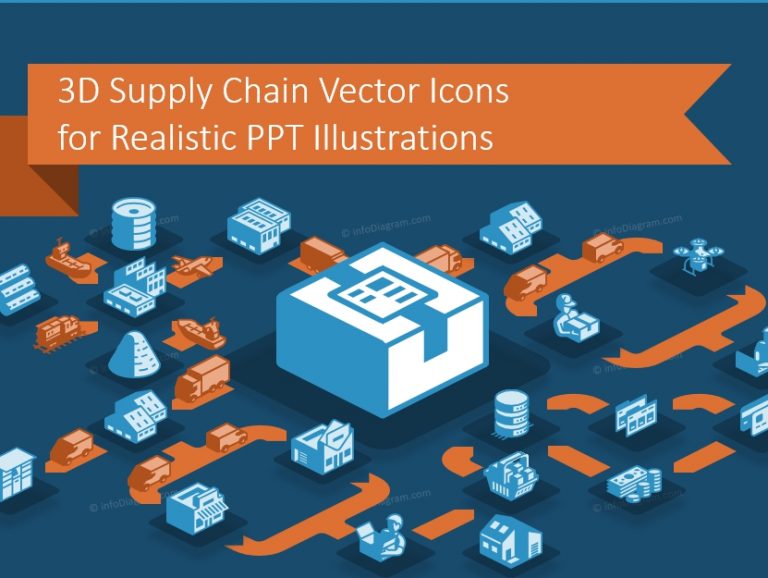
Why use 3D icons in a presentation? 3D logistics icons are useful for…
The topic of Supply Chain is pretty complex – with all global or…