Get Inspired – Presenting Marketing Mix Model
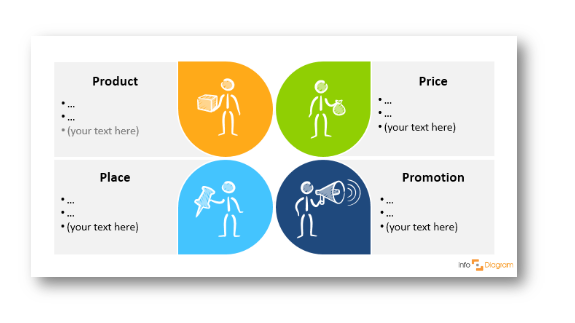
Many of us have heard of the marketing mix and 4P’s, but is…
Presentation visual ideas for marketing professionals – from market analysis, sales avatars, CSR, media planning, customer journey, and experience analysis to various survey reports.
Many of us have heard of the marketing mix and 4P’s, but is…
In the era of content marketing, everybody is speaking about an importance of a…
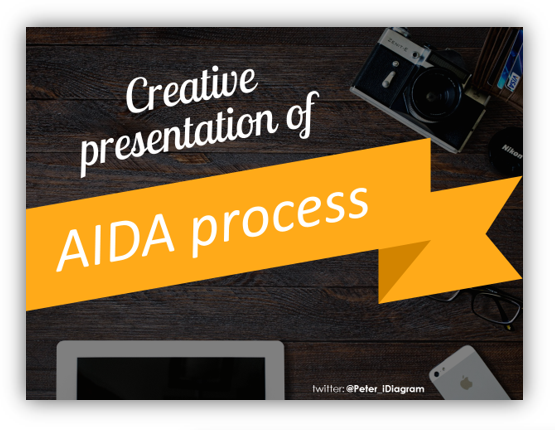
The AIDA Model identifies cognitive stages an individual goes through during the buying…
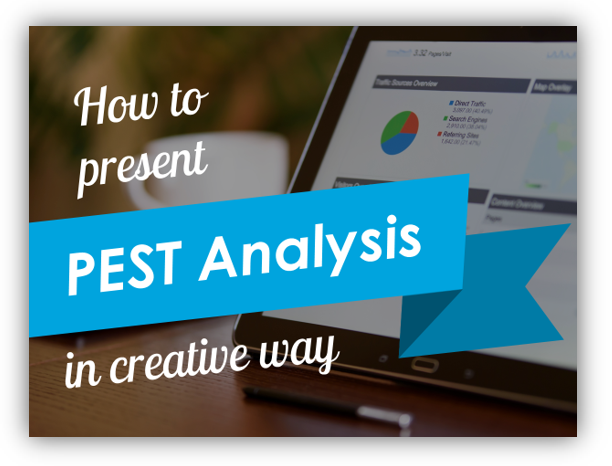
The PEST analysis is a useful tool for understanding market growth or decline,…
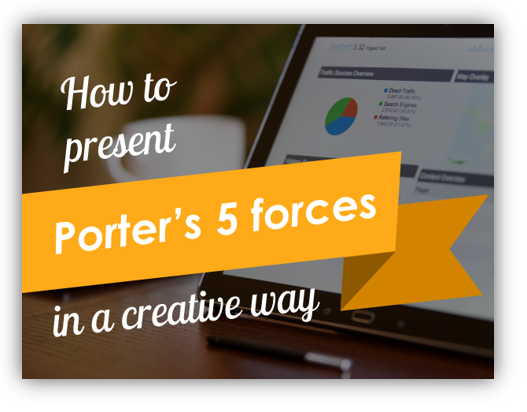
Do you want to visualize your strategy’s potential on the slide? In this…

Updated August 2026. Many of our clients report that July and August are…
When presenting to your team or another department, it can be difficult to…

Need to represent Your client in a presentation? Create a visual client profile illustration, so-called your…
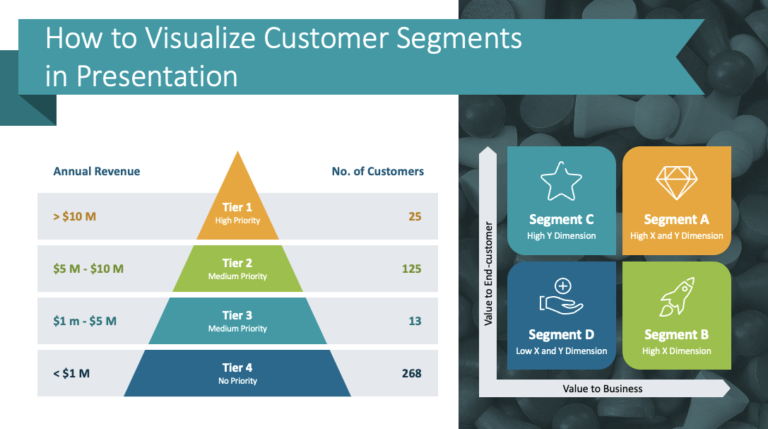
If you work in a company handling numerous customers, customer insight is an important…