
Illustrating Executive Data Report with PowerPoint Dashboards
Do you need to present multiple data charts and KPIs? Don’t know how…
Ideas for illustrating data in PowerPoint. See how data charts can be enriched graphically so they look more attractive and professional, while data is still editable.
Some blogs contain templates with real data (like macroeconomic values e.g. country GDP, population, or unemployment rates – based on recognized data sources). Or we added exemplary data.
Do you need to present multiple data charts and KPIs? Don’t know how…
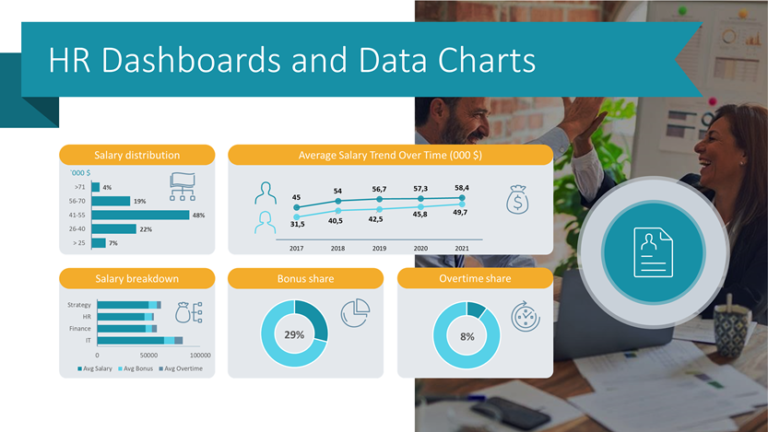
Need to present human resources-related metrics? Use an organized way to display important…
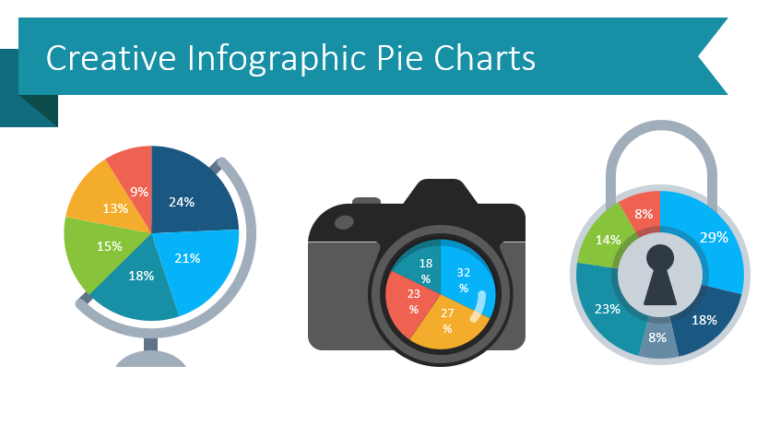
A pie chart is a very popular data visualization used in business presentations.…
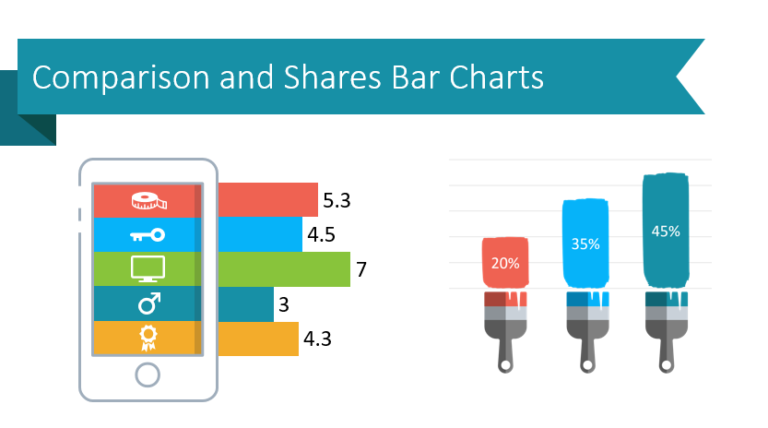
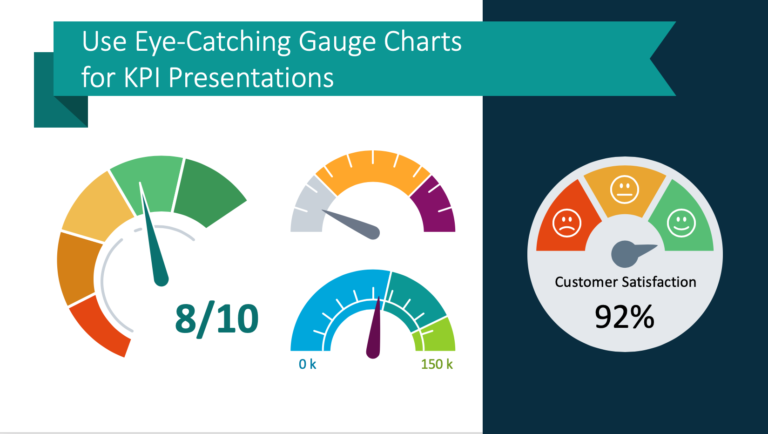
Do you need to make a data-driven PowerPoint presentation more engaging? Eye-catching visuals…
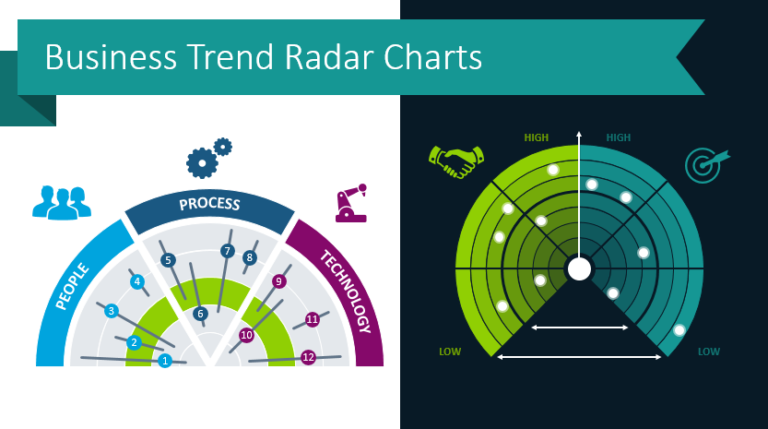
How to present your market trends and landscapes of new technologies in a…
Do you struggle to make your informative presentations interesting and engaging? If you…
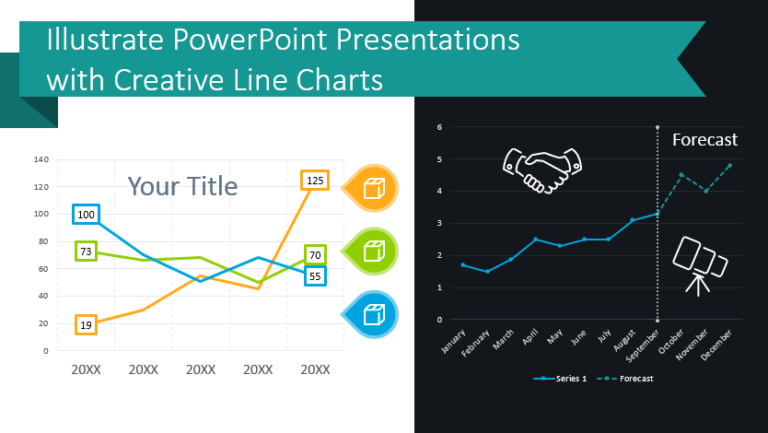
Are you presenting a data-heavy topic? If you are presenting sales trends or…
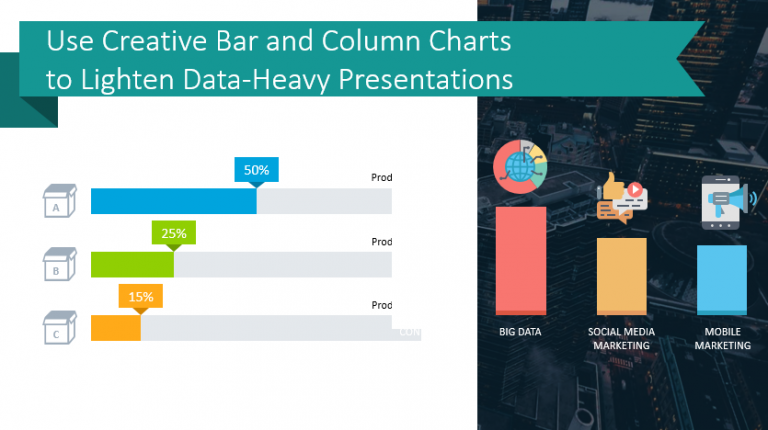
Is your next presentation containing a bunch of small graphs, default column chart…
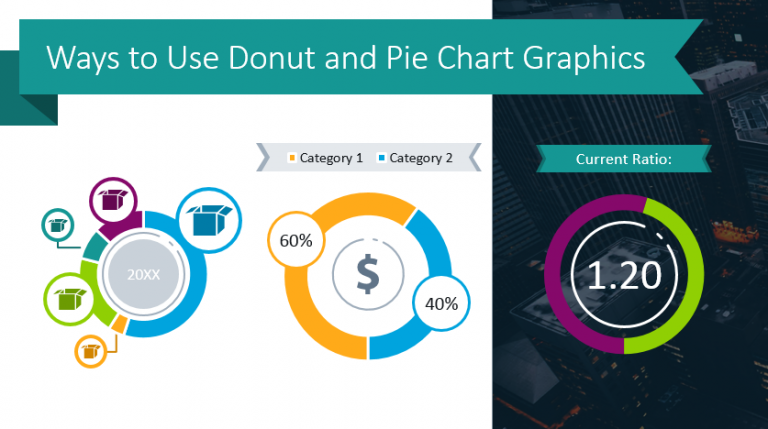
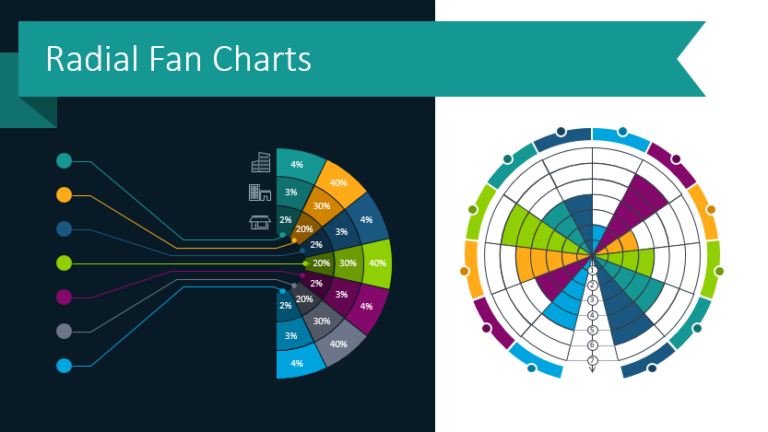
You are probably familiar with pie charts. Pie chart graphics are great for…