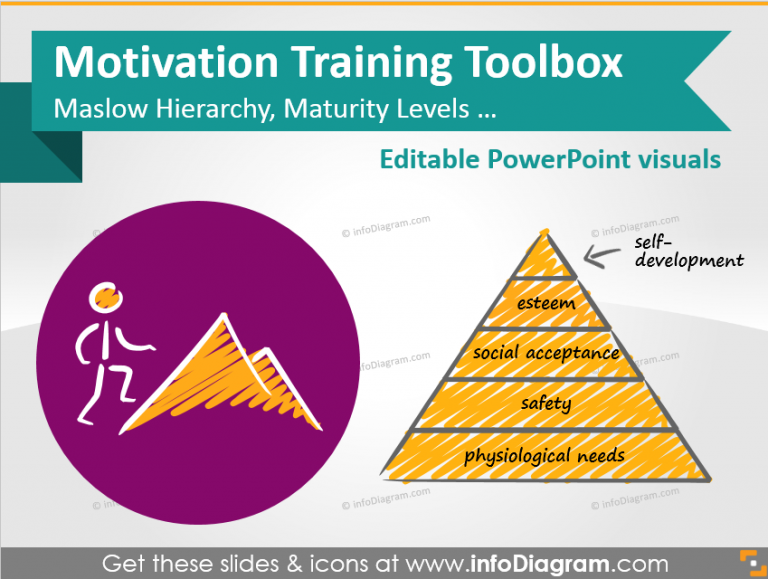
Motivation Training Presentation Template & Ideas
Communicating Motivation “Don’t worry about failures, worry about the chances you miss when…
Ideas for presenting specific business topics. Topics cover various industry and business sectors, like strategy management, marketing, economy, IT, data analytics, logistics, finance, healthcare, product development, and more. Those blogs can serve you as a source of inspiration and a good starting point, that you can develop further.
Communicating Motivation “Don’t worry about failures, worry about the chances you miss when…
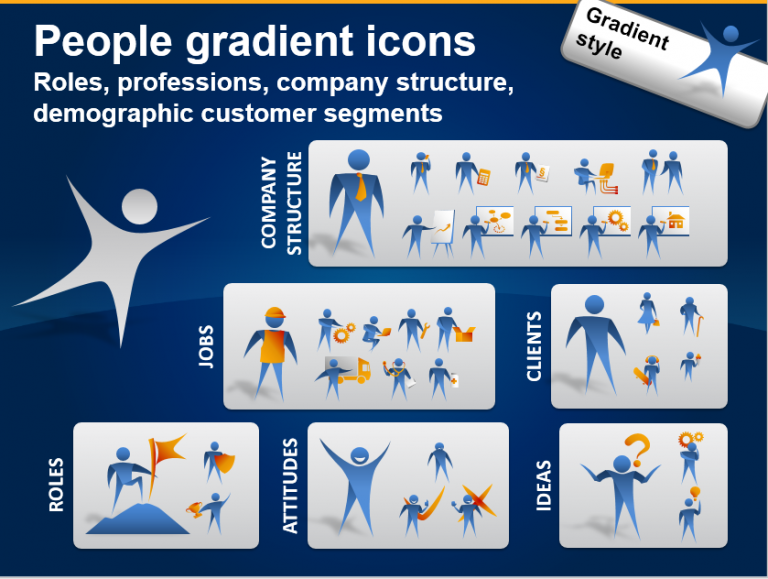
If you need to illustrate a person’s company role, customer segment, or attitude…
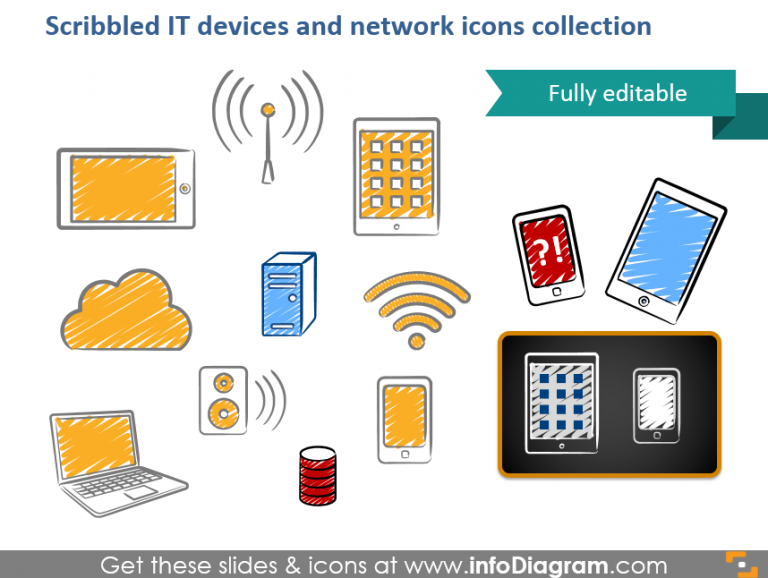
Are you seeking for a way to make your IT technical slides look…
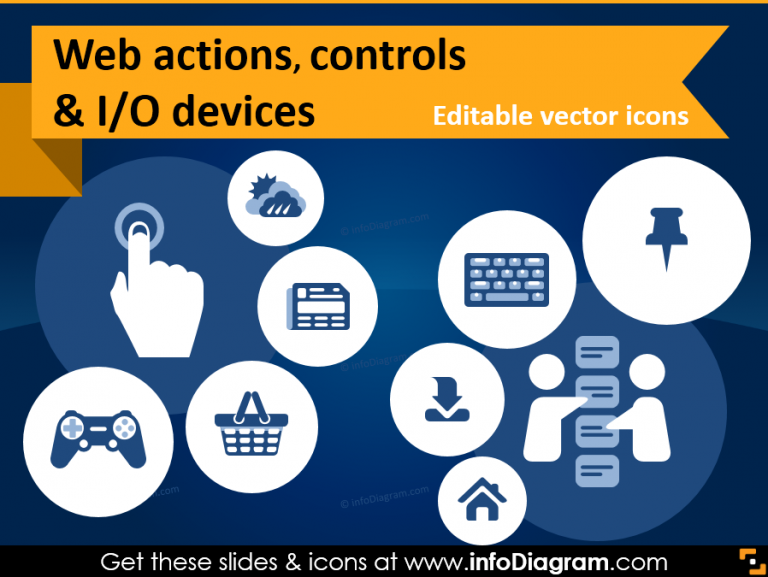
Do you have a presentation about website content? Are you redesigning a webpage and…
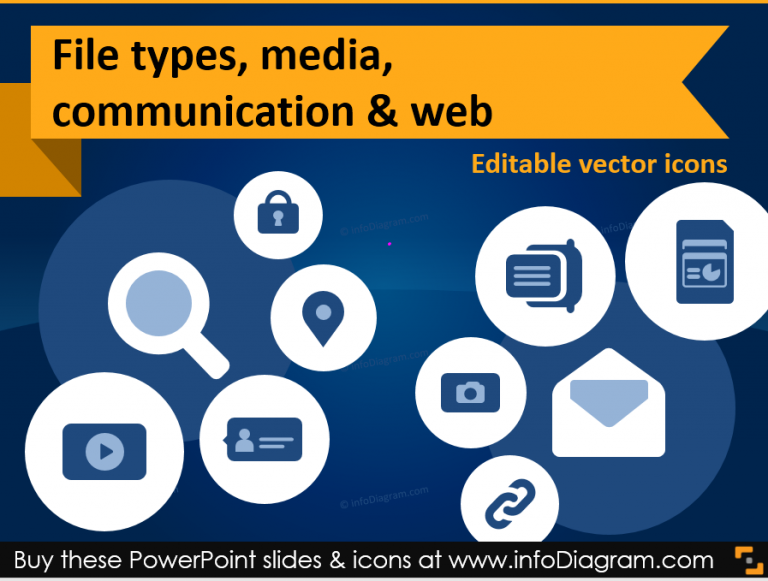
Having a presentation talking about informatics, websites, file types, and other IT concepts? Here are…

Let’s face it: we’ve all been to business meetings, where at one moment we…
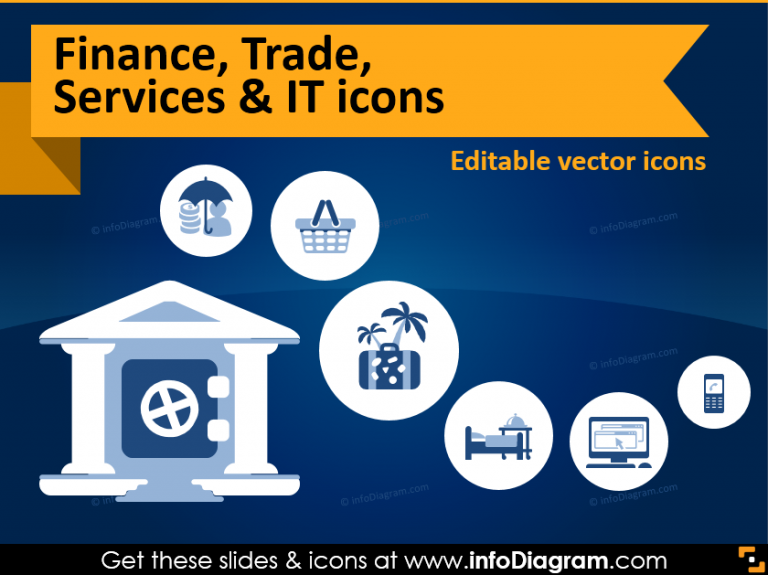
Talking about service industries such as finances, trade, or IT? All those dealing with…

Infographics are everywhere around us: they are bright, fast to catch, and easy…

Marketing is often more an art, than a science. At the same time,…
If you’re about to present a talent management issue to the key team…