How to Present Taxes on a Slide [concept visualization]
A question – how would you present taxes (or how did you if…
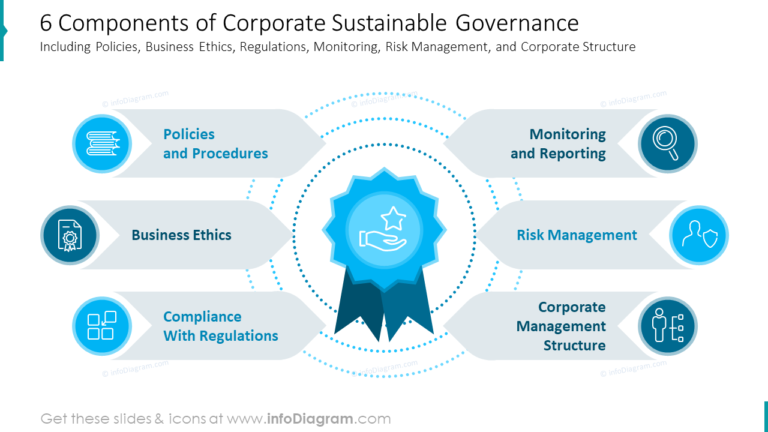
Why it’s worth adding icon illustrations to your document? Because they help to make content more attractive and easier to comprehend. Get inspired by visual metaphors you can use to visualize a business concept in a presentation.
A question – how would you present taxes (or how did you if…
Hey, here comes our next concept blog, suggesting you can show express “an…
Teamwork, harmony, synergy… How often do we hear these words in contemporary companies?…
List of visual metaphors to use to present a business concept in a…
If you’re working on market research or just planning the future of your…
‘The very last deadline is February the 29th!’ How often do we hear…
A few tips on how to express visually the idea of flexibility in…
In the era of content marketing, everybody is speaking about an importance of a…
The concept of knowledge or education appears in various places in presentations. You…
Is a security, safety or stability topic of your speech? Do you need to present…