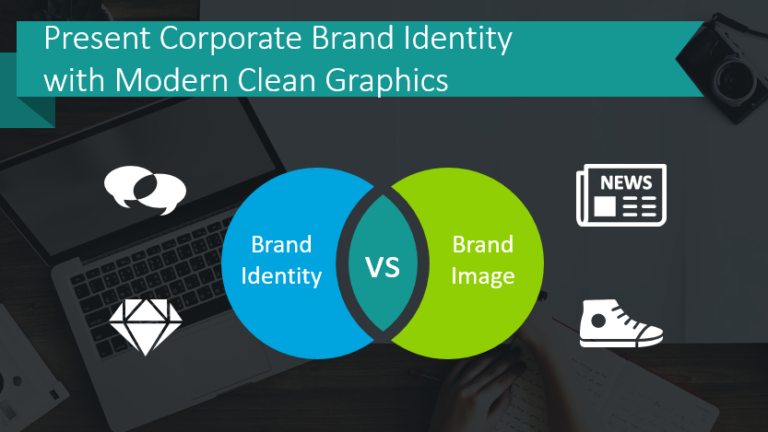
Present Corporate Brand Identity with Modern Clean Graphics
Do you need to share or explain your Brand Identity? Whether you need…
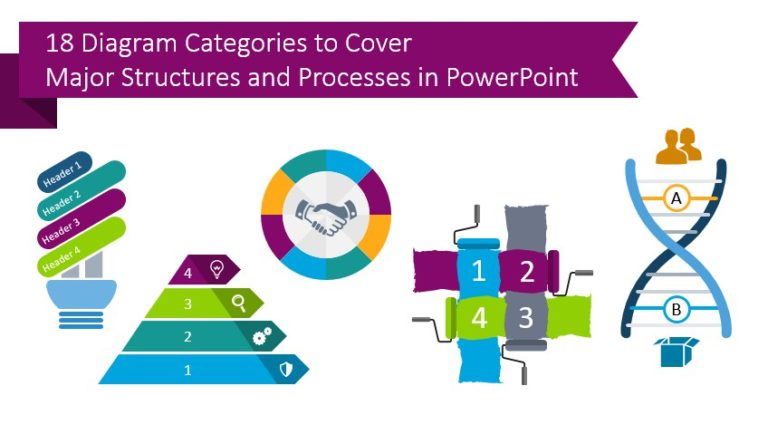
Graphical resources for any presentation and inspirational ideas on transforming the default slides into effective infographics. Read on to learn how you can make clear compelling presentations, and explain your ideas and concepts in an easy-to-grasp visual way.
Do you need to share or explain your Brand Identity? Whether you need…
Providing visual clarity is essential, even when utilizing creative graphics. You can benefit…
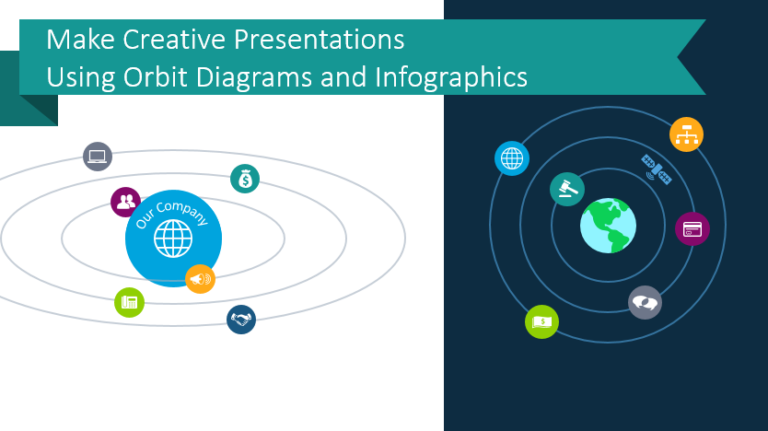
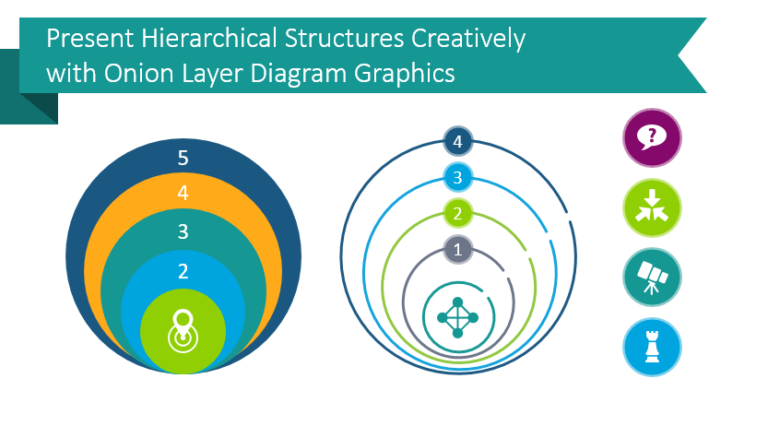
Do you have to present a topic with one central theme or element?…
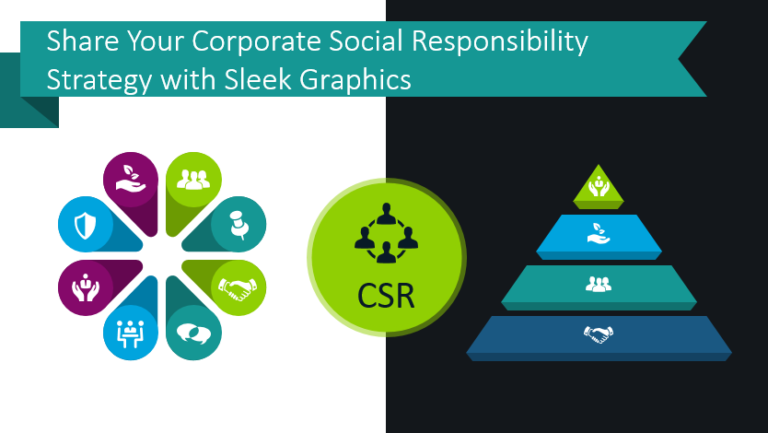
Is your company or organization focusing on CSR? If so, you can present…
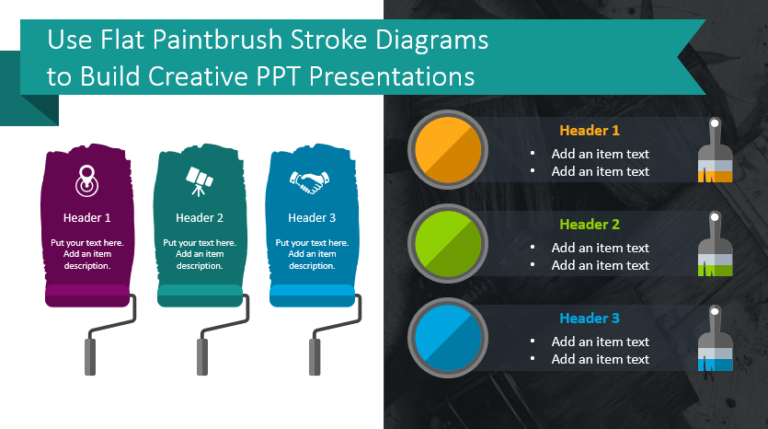
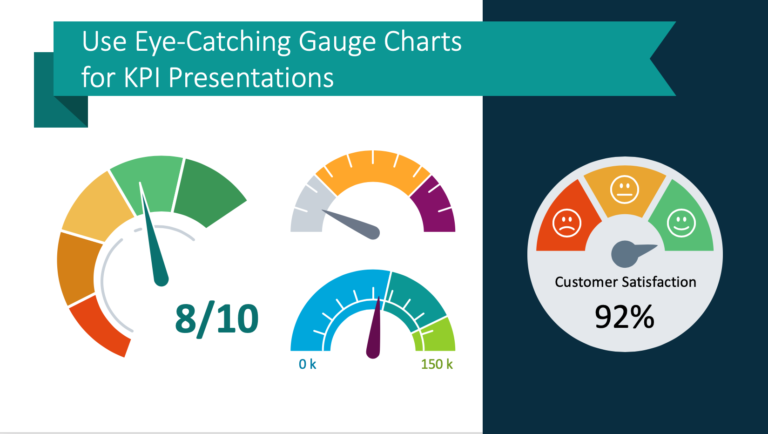
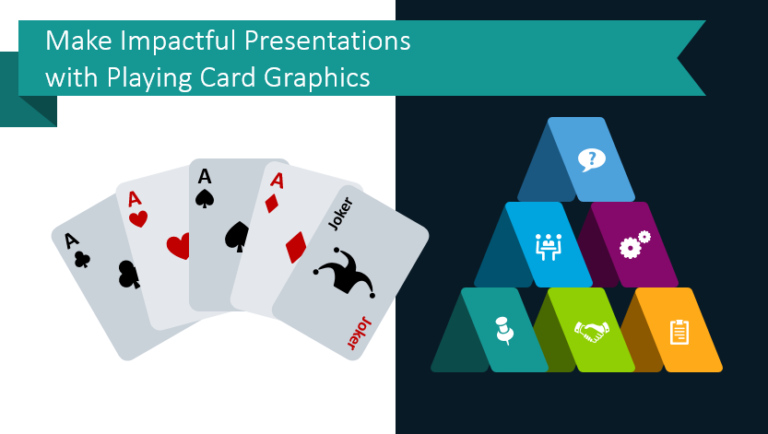
Do you wish you could present the listed information in an interesting way?…
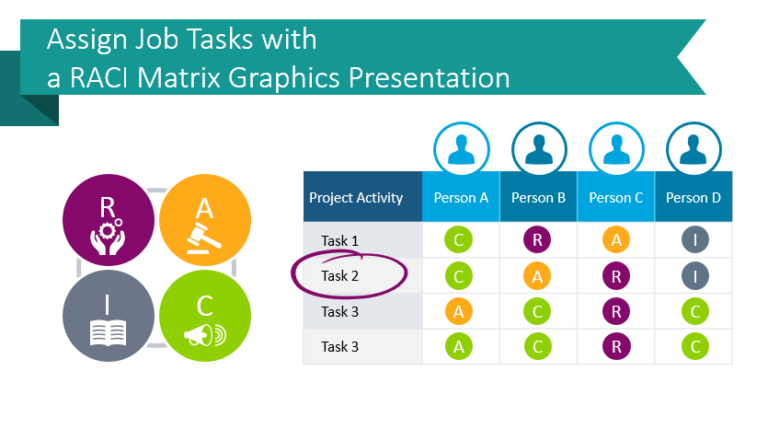
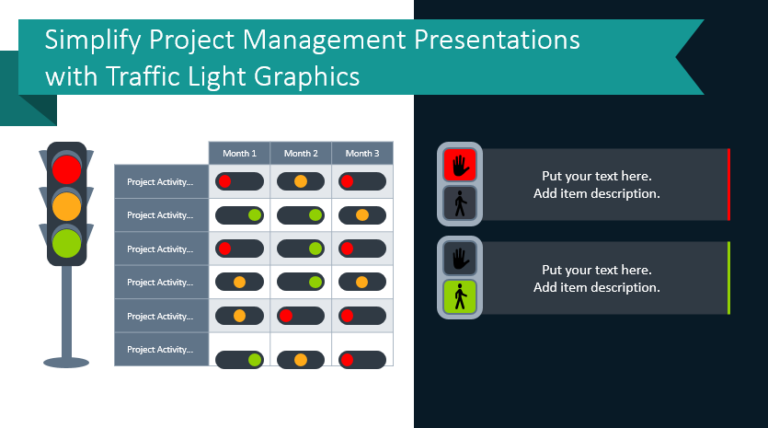
Giving project management presentations is difficult. How can you keep your audience engaged…