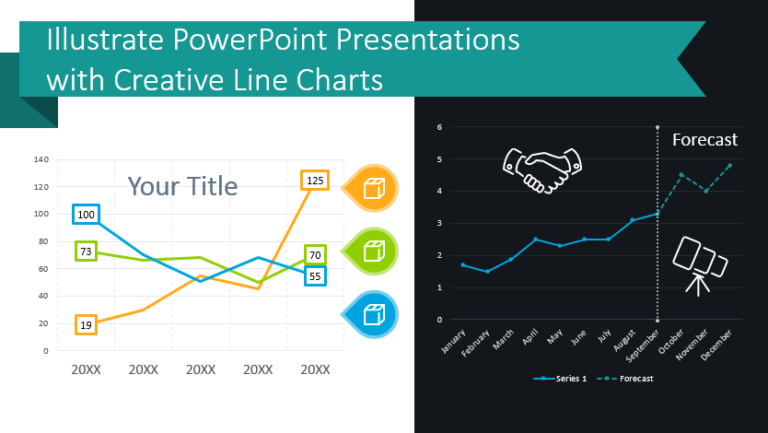
Illustrate Data-Heavy PPT Presentations with Creative Line Charts
Are you presenting a data-heavy topic? If you are presenting sales trends or…
Graphical resources for any presentation and inspirational ideas on transforming the default slides into effective infographics. Read on to learn how you can make clear compelling presentations, and explain your ideas and concepts in an easy-to-grasp visual way.
Are you presenting a data-heavy topic? If you are presenting sales trends or…
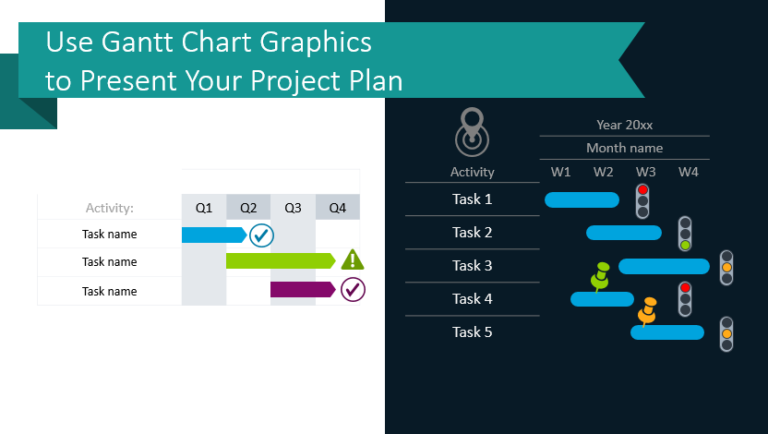
You want to present your project plan because it makes it easier to…

It’s this time of the year… Time to make plans! If you’re about…
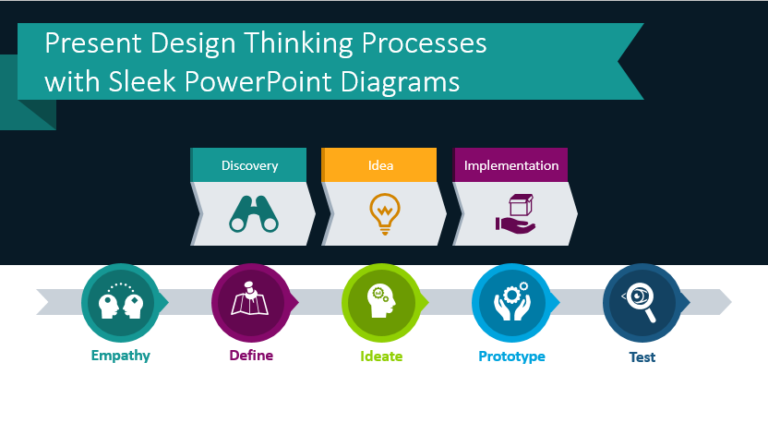
Do you use the design thinking process in or on behalf of your…
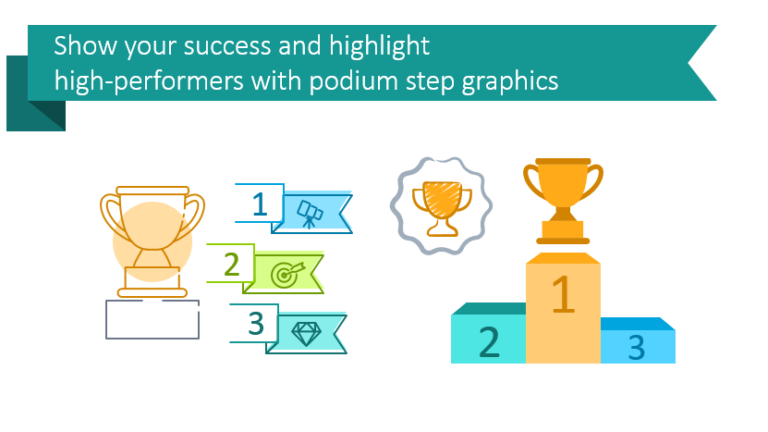
Want to present your top performers or share which products sold the best…
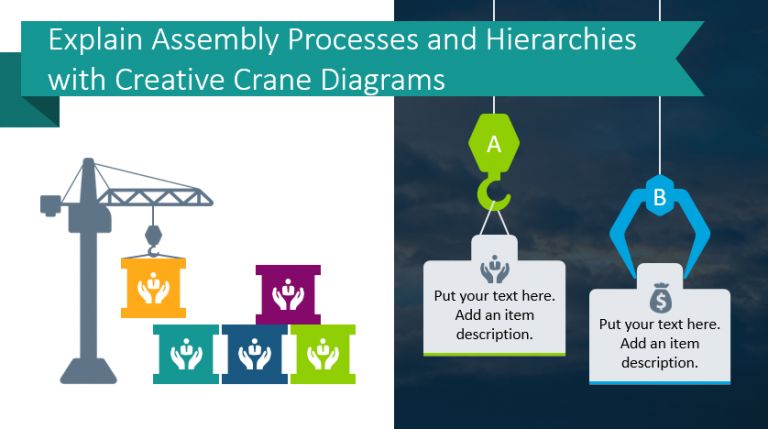
Are you presenting a process that splits into 2 or more elements? Don’t…
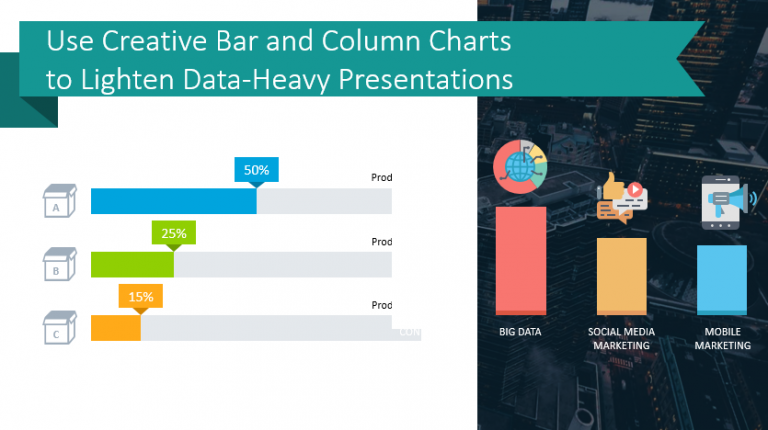
Is your next presentation containing a bunch of small graphs, default column chart…
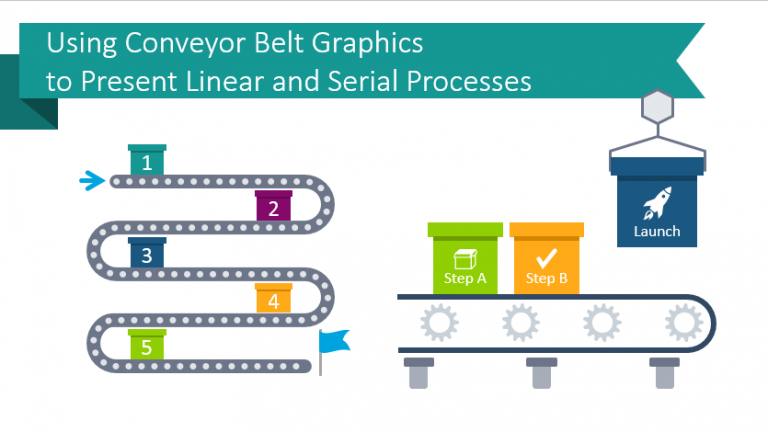
Presenting a set of steps or a sequential process? Need to explain a…
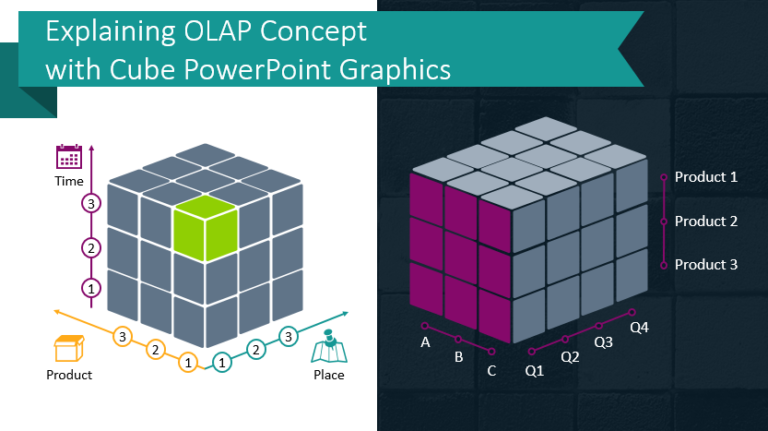
Creating visuals for abstract ideas is challenging. Do you wish you could present…