
Use Creative IT Diagrams to Present Network Topology
Do you need to give a presentation on technical IT concepts such as…
Graphical resources for any presentation and inspirational ideas on transforming the default slides into effective infographics. Read on to learn how you can make clear compelling presentations, and explain your ideas and concepts in an easy-to-grasp visual way.
Do you need to give a presentation on technical IT concepts such as…
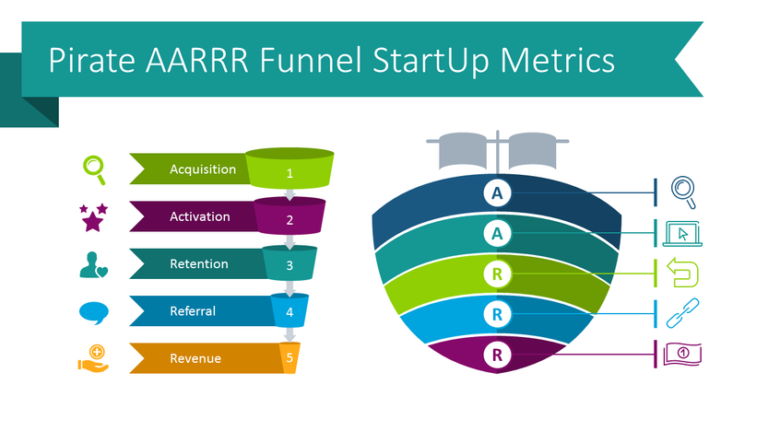
The pirate funnel is great for measuring and presenting the effectiveness of your…
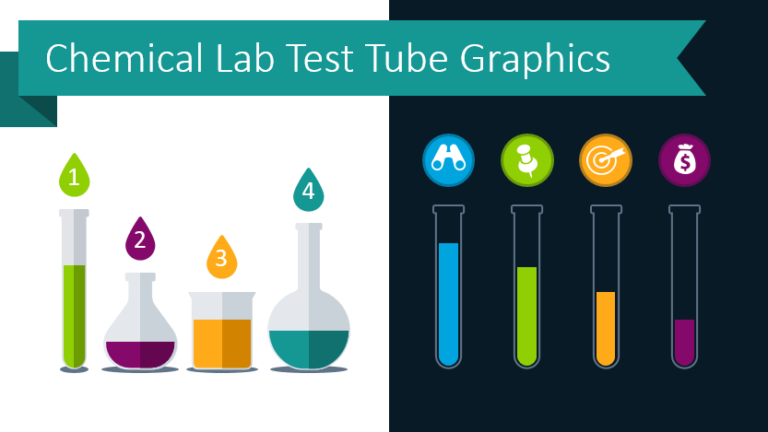
Being creative in business is essential. Whether you’re coming up with the latest…
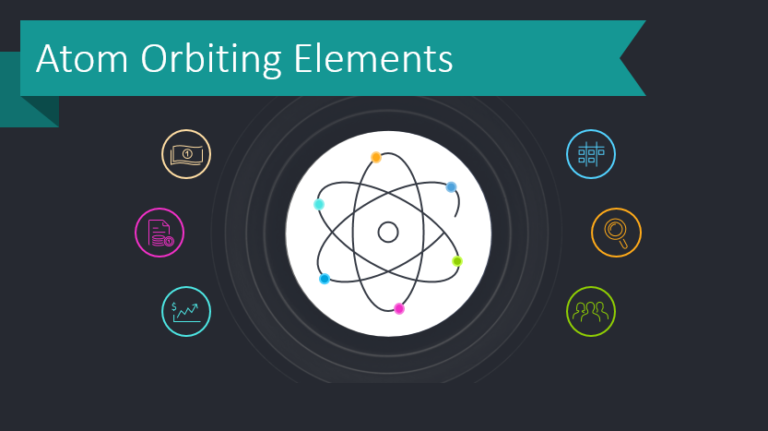
Do you know how atoms can help you in business? To answer that…
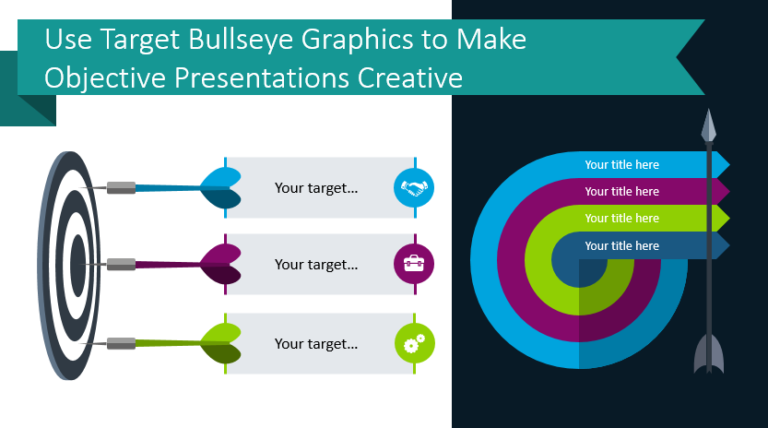
Do you need to present your company objectives, goals, or targets? If you…
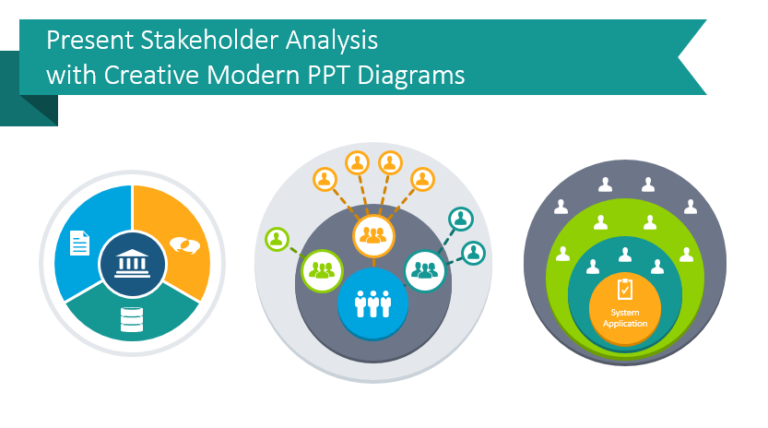
Who are your stakeholders? If you need to explain the stakeholder analysis and…

In the emergence of global coronavirus pandemics, we want to help the way…
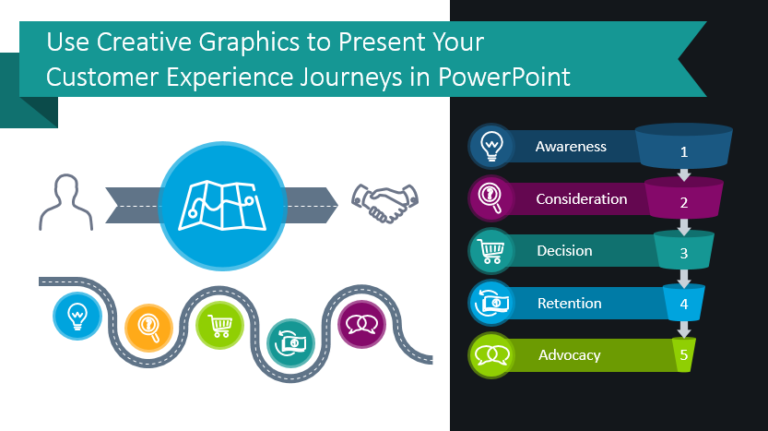
Do you and your team give much thought to your customers’ experiences? If…
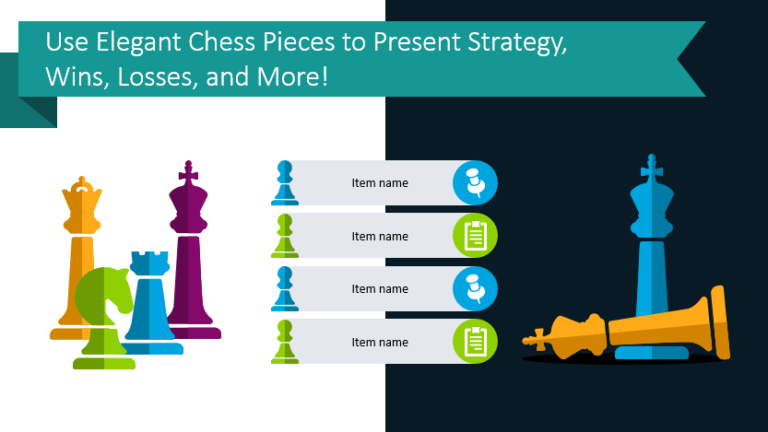
Strategies, value and tactical processes are difficult to present. Chess pieces are easy…
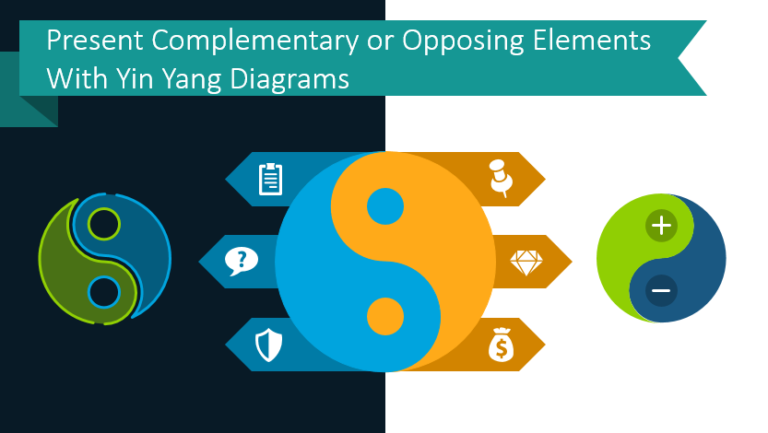
What is a good way to visually express opposition or correlation? Using easily…