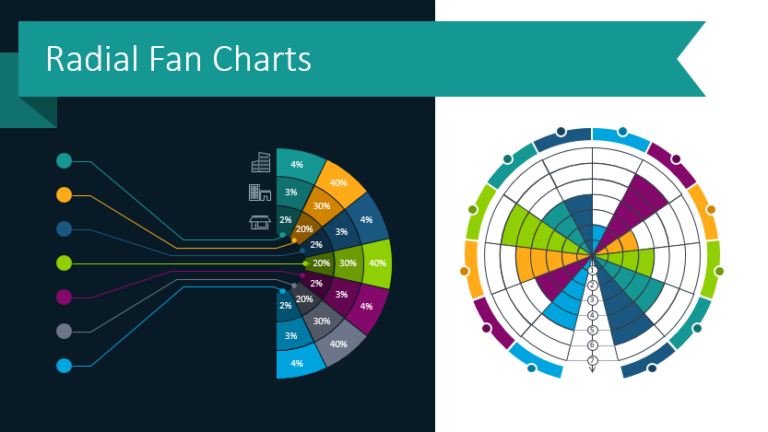
Present Industry Trends, Survey Results and more with Radial Charts
Do you struggle to make your informative presentations interesting and engaging? If you…
Graphical resources for any presentation and inspirational ideas on transforming the default slides into effective infographics. Read on to learn how you can make clear compelling presentations, and explain your ideas and concepts in an easy-to-grasp visual way.
Do you struggle to make your informative presentations interesting and engaging? If you…
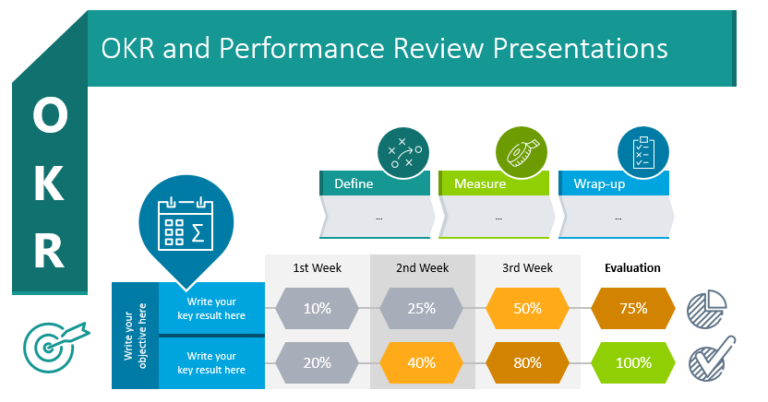
Does your organization conduct performance reviews? Probably so. Even if you don’t utilize…
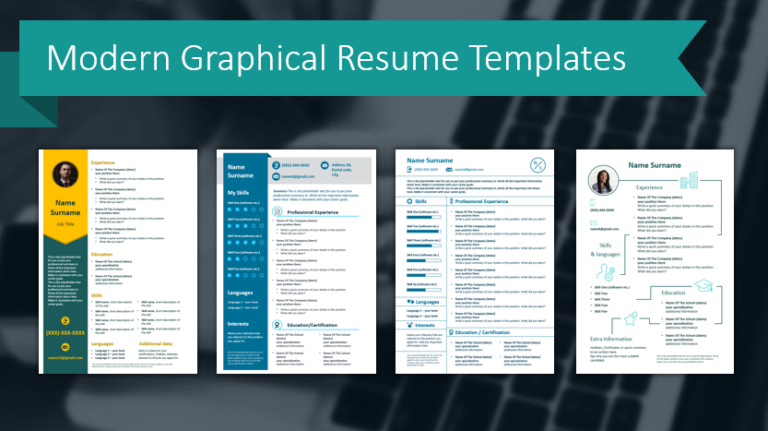
Do you want to stand out when job hunting? Then you need to…

Are you a healthcare provider or medical researcher? If you’ll be presenting on…

Medical issues, whether they are diseases or other health conditions, can be complicated…
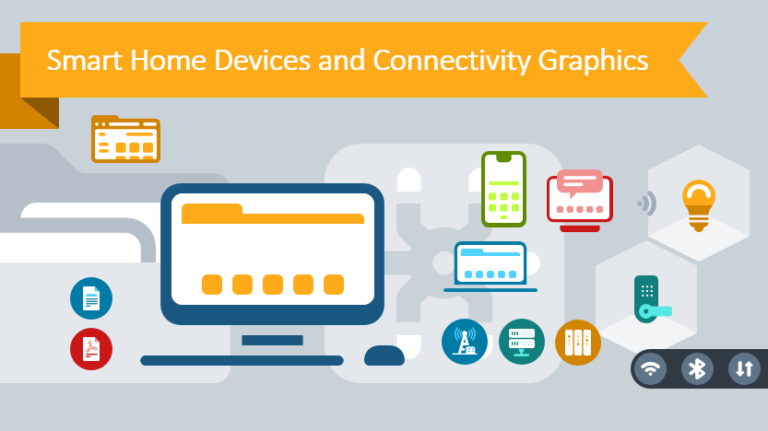
Do you need to present on Smart Home Devices and Connectivity topics? Creating…
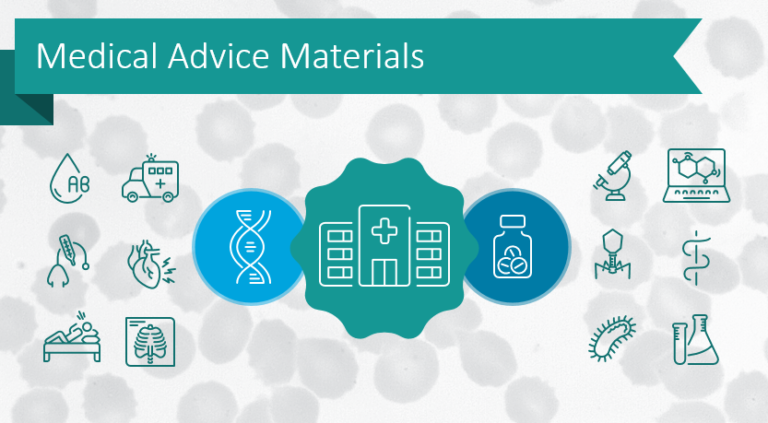
Healthcare and medical advice materials and presentations need to look professional. Professionalism is…
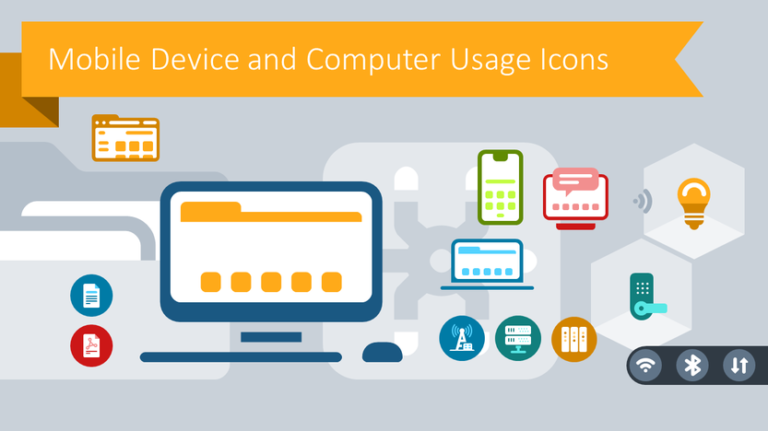
Mobile device and computer usage presentations don’t have to be boring. Whether you’re…

Healthcare and medical professionals report familiar struggles with presentations. Those in healthcare, including…
Basic presentations on computer and telecom topics are always risky. If your audience…