Use PowerPoint to Make a Stylized Process Flowchart
What is a flowchart? How might a flowchart benefit your presentations? A flowchart…
Graphical resources for any presentation and inspirational ideas on transforming the default slides into effective infographics. Read on to learn how you can make clear compelling presentations, and explain your ideas and concepts in an easy-to-grasp visual way.
What is a flowchart? How might a flowchart benefit your presentations? A flowchart…
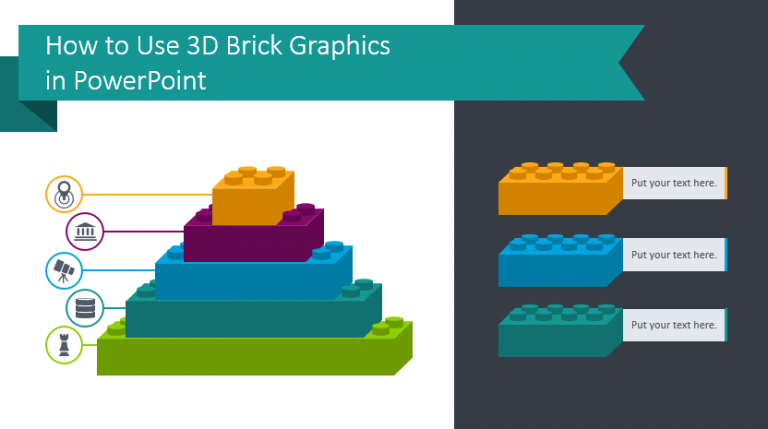
Would you like to have more fun with your presentations? Incorporate plastic building…
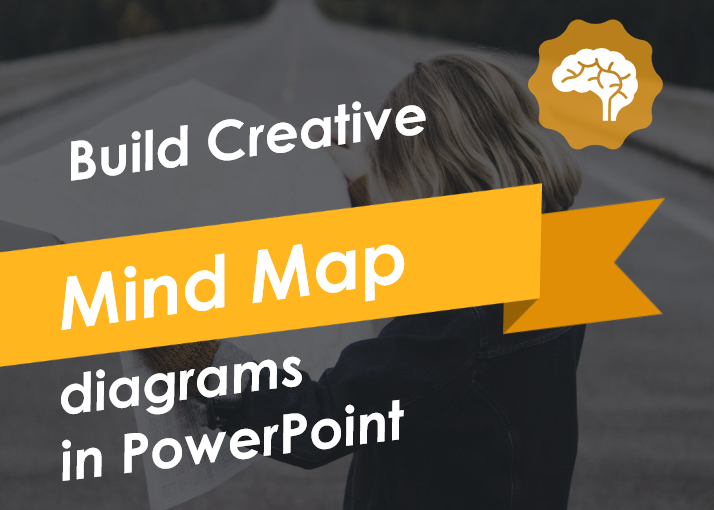
Mind Maps are visualization methods. Mind map diagrams are designed to help you…
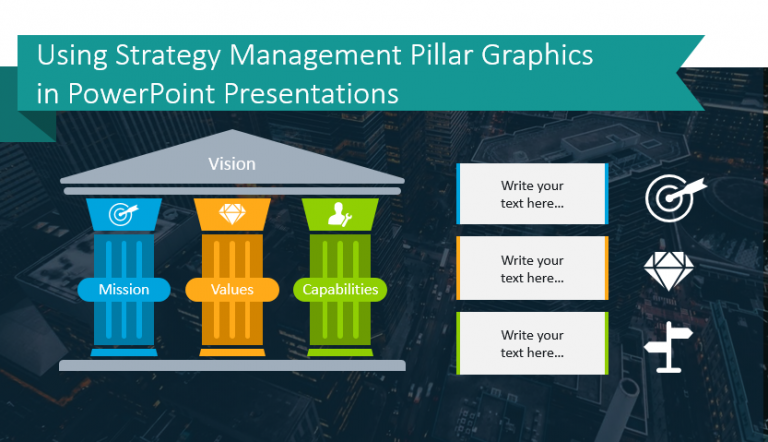
Ancient pillars are the perfect visual metaphor for the essential values of business…
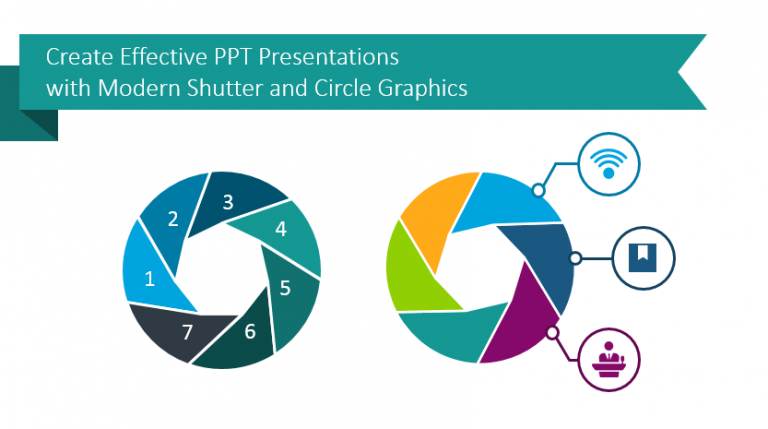
Are you sick of using lists in presentations? Do you wish you had…
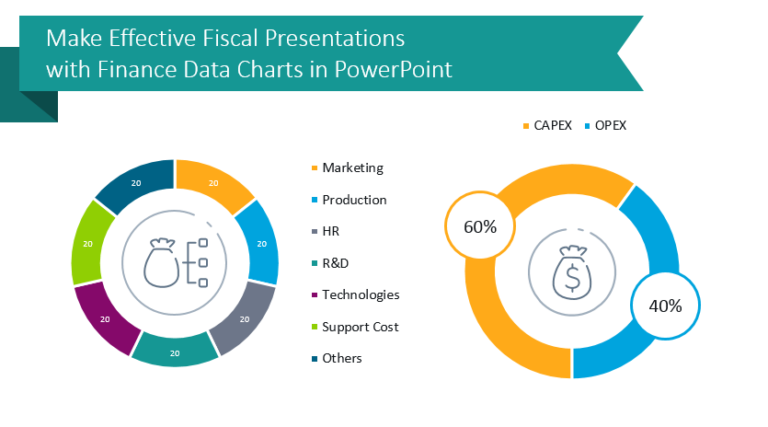
Are you making a financial review for your company or organization? Presenting financial…
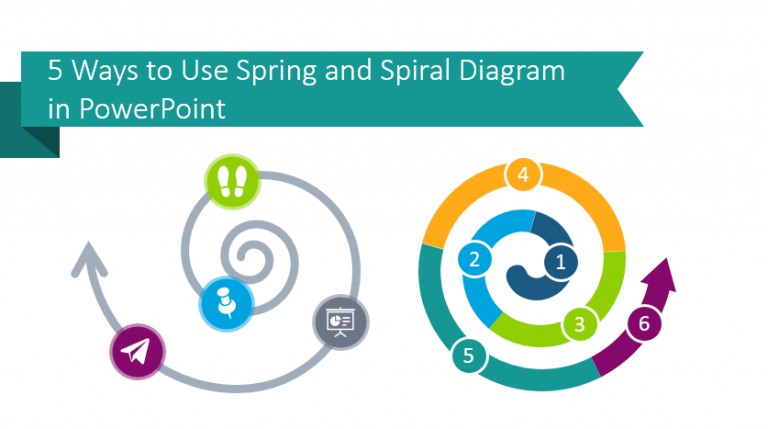
Do you need to present development processes? Are you explaining or sharing growth?…
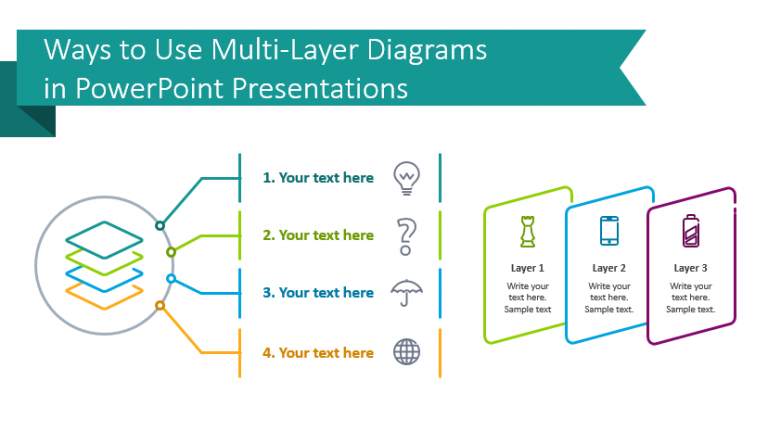
Multi-layer diagrams and flow charts are great for presenting many hierarchies and processes.…
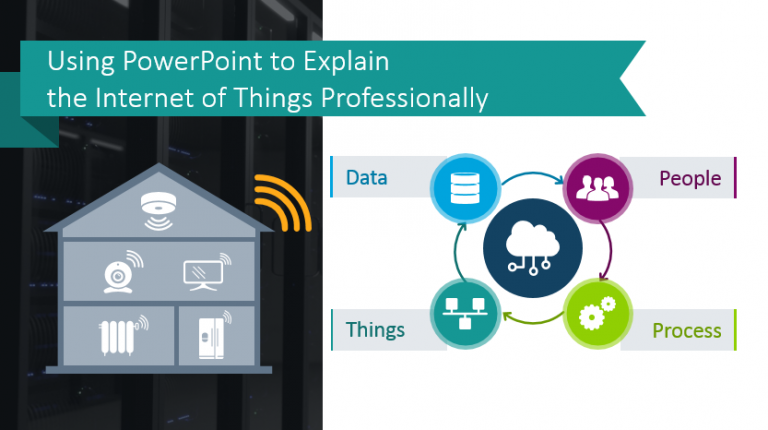
The Internet of Things is the extension of internet connectivity to physical devices.…
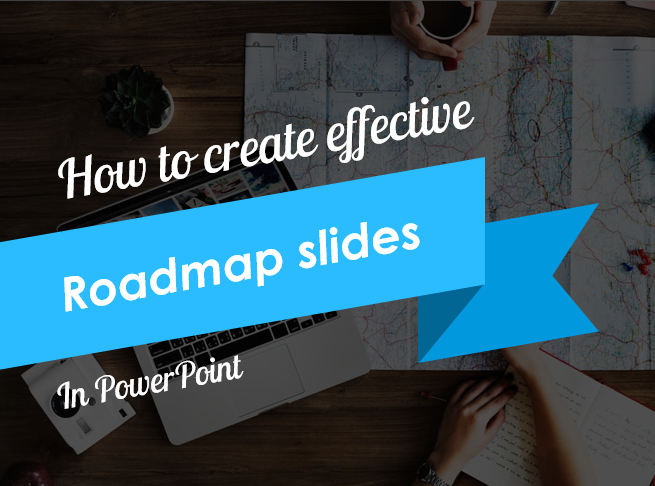
Do you know how to create roadmap slides in PowerPoint? If not, you…