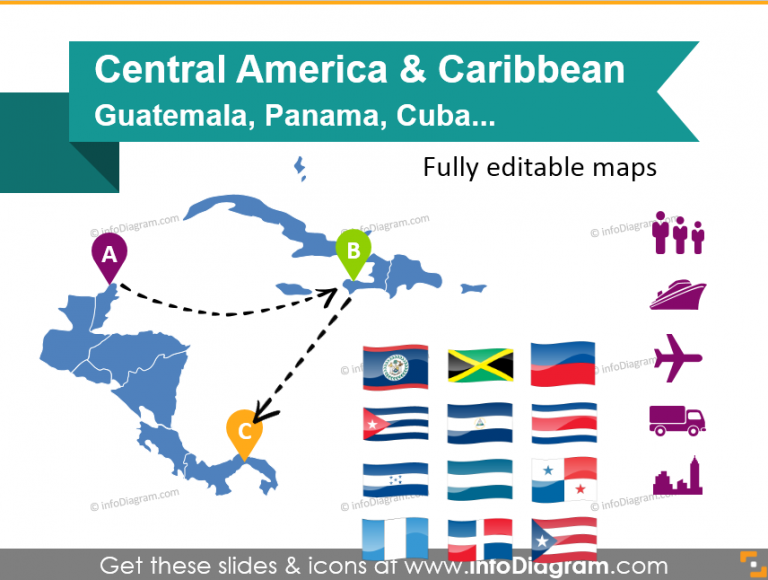
Central America Countries: Best Ways to Present Maps Creatively
Having logistics or a supply chain presentation? In this blog, we propose examples…
Graphical resources for any presentation and inspirational ideas on transforming the default slides into effective infographics. Read on to learn how you can make clear compelling presentations, and explain your ideas and concepts in an easy-to-grasp visual way.
Having logistics or a supply chain presentation? In this blog, we propose examples…
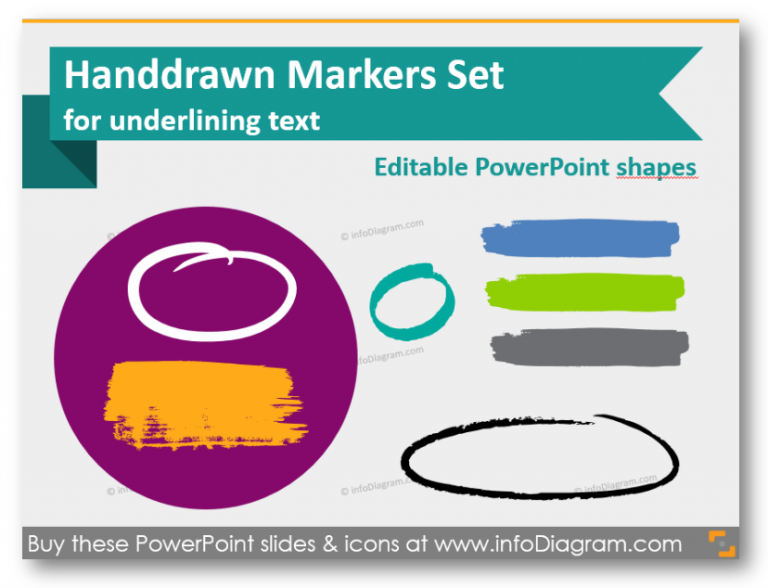
Want to stick the attention of your presentation audience to the specific keyword,…

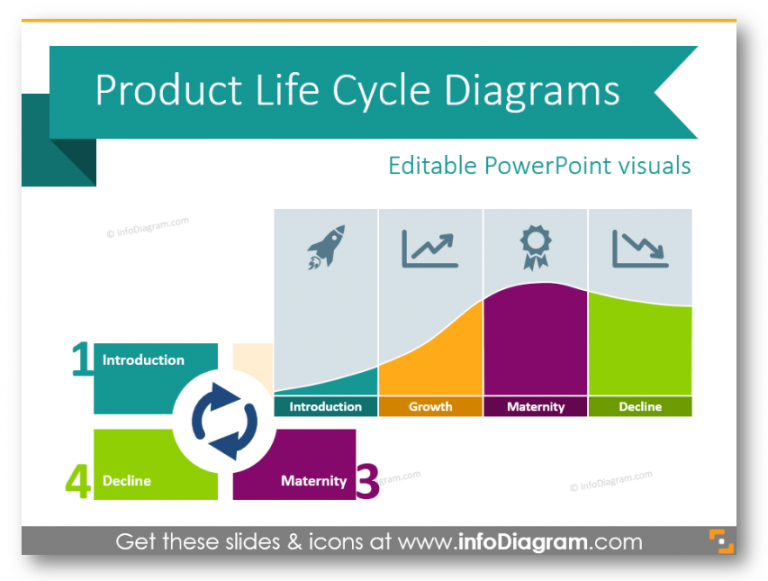
Looking for a way to present and promote your startup? You can have…
Preparing for a presentation about cloud technologies or any IT concepts? Trying to…

If your presentation is in a flat style, but you want to add…

We’re living in the Internet age when almost every business has its website…

Presenting your own company is a common part of every business conference, sales meet-up,…

Want to illustrate a comment, quote, or dialogue, or make an interesting creative…
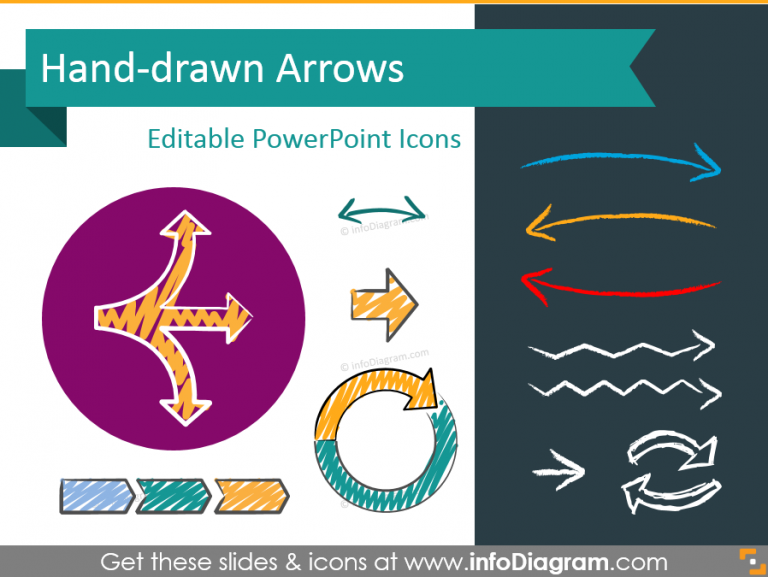
When do we use arrows? The most common cases are to show a…