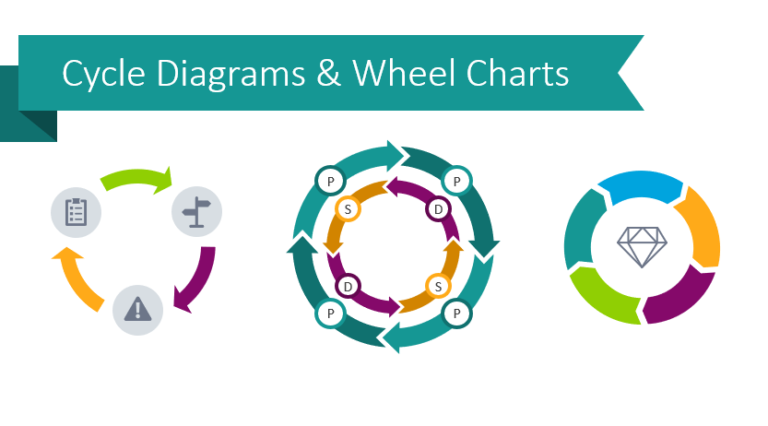
How to Visualize a Process Using Gears Graphics in PowerPoint
Do you want to present a process flow on a slide in a…
Graphical resources for any presentation and inspirational ideas on transforming the default slides into effective infographics. Read on to learn how you can make clear compelling presentations, and explain your ideas and concepts in an easy-to-grasp visual way.
Do you want to present a process flow on a slide in a…
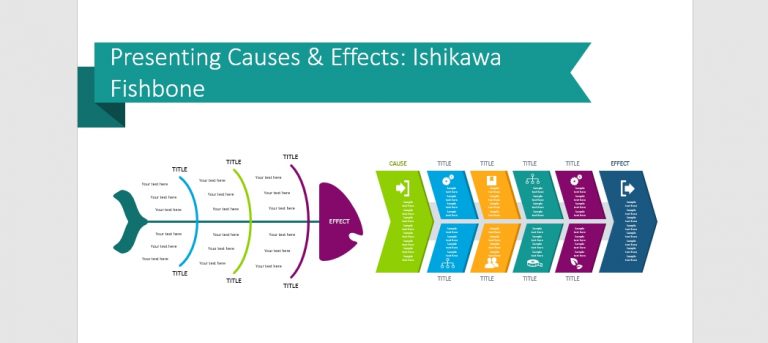
Working on a problem-solving presentation? In this blog, we are presenting 5 examples…
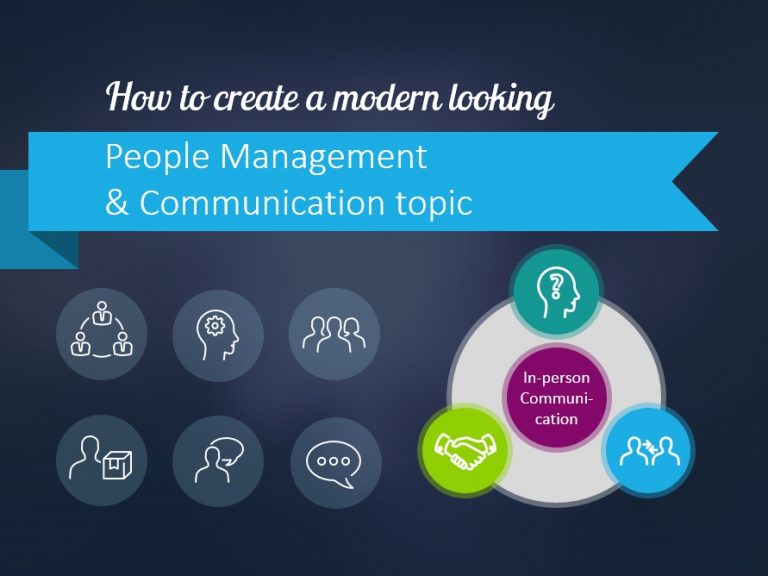
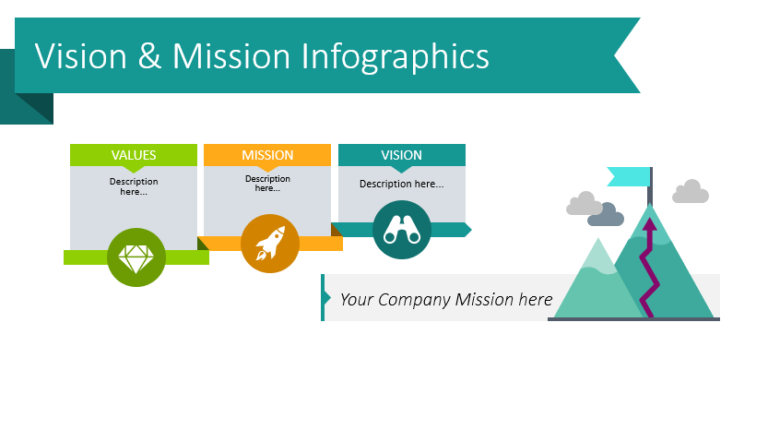
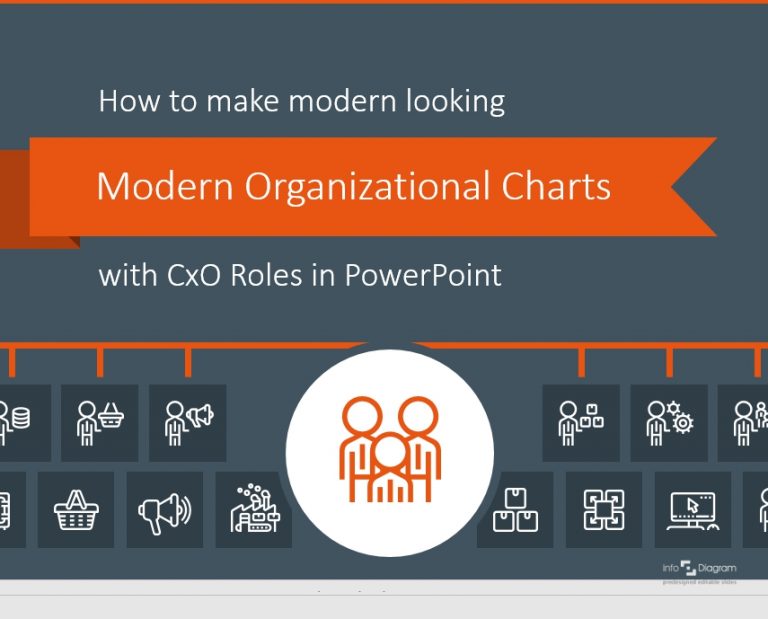
Are you making a presentation for a management or HR meeting? Or an…
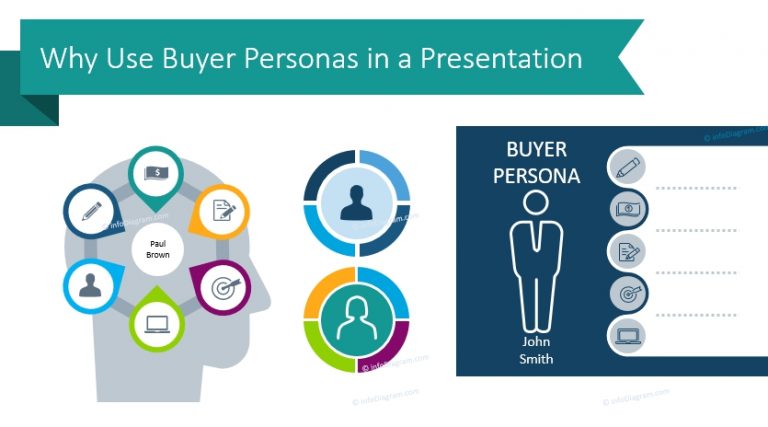
If you don’t have a buyer persona in place, you should think about…
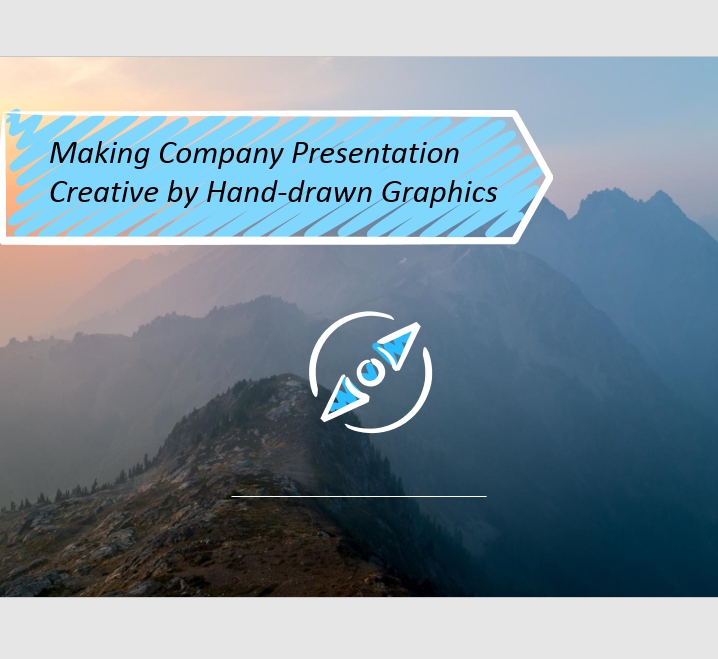
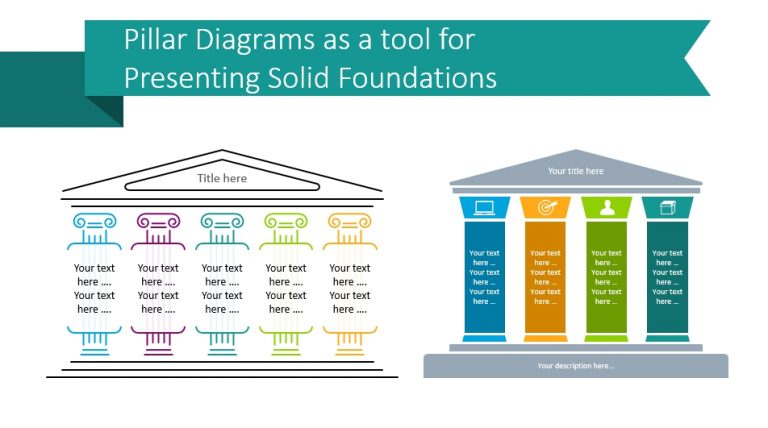
Need to present your company pitch and your solution? Presenting What and Why…
Are you preparing slides for an upcoming webinar? After preparing the content and…