How to Illustrate Triple Bottom Line Business Model Creatively in PowerPoint

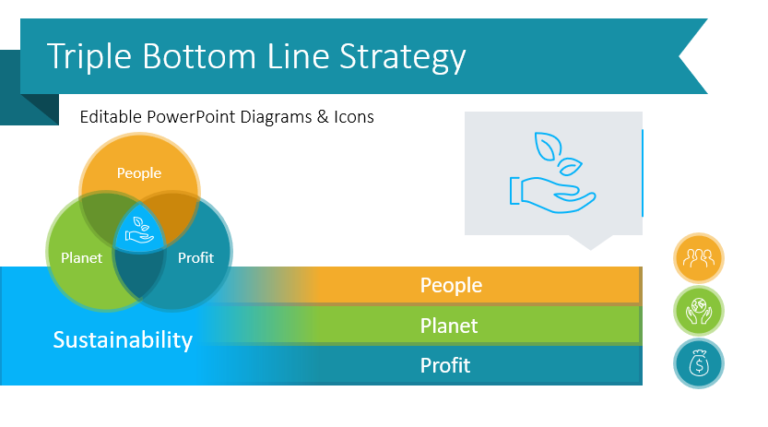
Working on sustainability strategy? Looking for an effective way to communicate it? If you need to present the triple bottom line business model, check this blog for visualization examples and inspiration.

Continue reading How to Illustrate Triple Bottom Line Business Model Creatively in PowerPoint

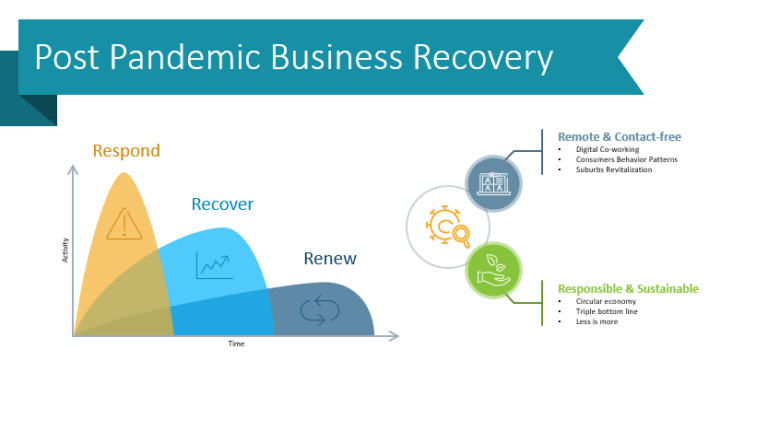
10 Infographic Ideas for Post-Pandemic Business Recovery Plan Presentation

Coronavirus pandemic has significantly impacted all spheres of our lives. Economies, education, healthcare, business have all been affected by its consequences. If you are working on a post-pandemic business recovery plan, check this blog with examples on how to present crisis management in a clear, informative, and visually appealing manner.

Continue reading 10 Infographic Ideas for Post-Pandemic Business Recovery Plan Presentation

Illustrating Next Steps and Follow-Up in a Presentation [concept visualization]

The next steps and follow-up concept frequently appears over various types of presentations, for example, business update meetings with your team or project planning gathering. In this blog, you can find visual metaphors expressing ideas of illustrating the next step concept, which you can add to slides and make them look attractive.

Continue reading Illustrating Next Steps and Follow-Up in a Presentation [concept visualization]

How to Illustrate Precision in a Presentation [concept visualization]

If you work on a presentation where you want to express ideas of precision, attention to details or high accuracy, you may want to underline this concept by a simple readable illustration. We have collected a bunch of visual metaphors expressing ideas of precision, that you can add to your slides. 

Continue reading How to Illustrate Precision in a Presentation [concept visualization]

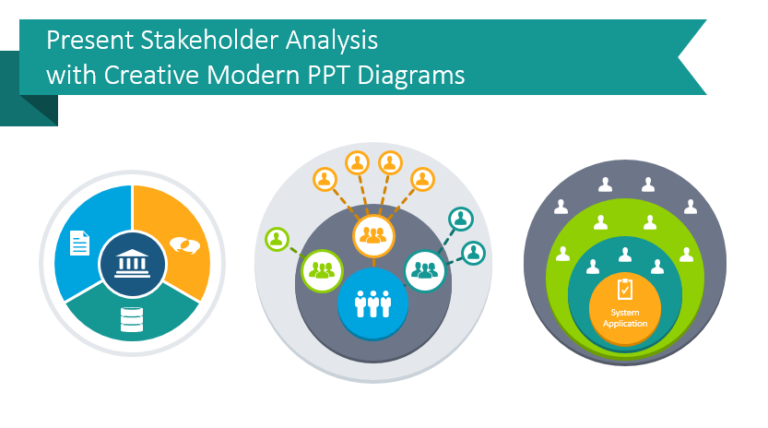
Present Stakeholder Analysis with Creative Modern PPT Diagrams

Who are your stakeholders? If you need to explain the stakeholder analysis and how your community and other stakeholders should factor into your business strategy, processes, or finances you may benefit from stakeholder graphics. Organizational structure, including stakeholders, are often varied layers. Using visuals on your slides rather than relying on paragraphs or your spoken words will help your audience conceptualize and understand these abstract ideas.

Continue reading Present Stakeholder Analysis with Creative Modern PPT Diagrams

Using Strategy Management Pillar Graphics in PowerPoint Presentations

Ancient pillars are the perfect visual metaphor for the essential values of business strategy. The different pillars of business excellence represent the core values. They form the foundation and support the “roof” – the company vision. See illustration examples on how you can incorporate pillar graphics into your slides.

Continue reading Using Strategy Management Pillar Graphics in PowerPoint Presentations

How to Create Effective Roadmap Slides in PowerPoint

Do you know how to create roadmap slides in PowerPoint? If not, you could be missing out on a great opportunity. Roadmap slides are perfect for presenting a product or strategy plan.

Continue reading How to Create Effective Roadmap Slides in PowerPoint

Make Creative Product and Strategy Presentations with Roadmap Tables

Roadmap tables graphic are a representation of the timeline for product development or company strategies. These strategies might be planned for months or years in the future. They are marked with project milestones or company objectives. You can also highlight the duration of tasks or the deadlines for achieving certain deadlines.

Continue reading Make Creative Product and Strategy Presentations with Roadmap Tables

Help Your Audience Connect the Dots by Presenting Visual Metaphor Bridge Diagrams

What do you think when you hear the phrase ‘bridge the gap’? This concept has many different applications. Whether you’re bridging the gap between different industries, departments, or teams, or simply connecting two concepts, bridge diagrams can help your audience understand.

Continue reading Help Your Audience Connect the Dots by Presenting Visual Metaphor Bridge Diagrams

Illustrate Strategies with Milestones by Curved Roadmap PPT

Looking for a way to illustrate a plan, journey, or steps and milestones? With the approaching new year, this topic is especially relevant now 🙂

Continue reading Illustrate Strategies with Milestones by Curved Roadmap PPT