Presenting Cause & Effect visually – DIY Fishbone Ishikawa Diagram in PowerPoint
To present cause and effect analysis, support your message by using proper visuals.…
Graphical resources for any presentation and inspirational ideas on transforming the default slides into effective infographics. Read on to learn how you can make clear compelling presentations, and explain your ideas and concepts in an easy-to-grasp visual way.
To present cause and effect analysis, support your message by using proper visuals.…
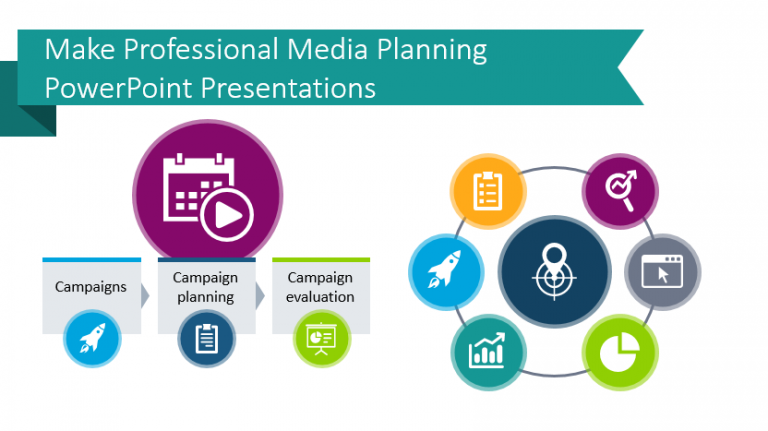
Are you planning to leverage the media to market your goods or services?…

Do you need to present web analytics? Whether you’re explaining a website analytics…
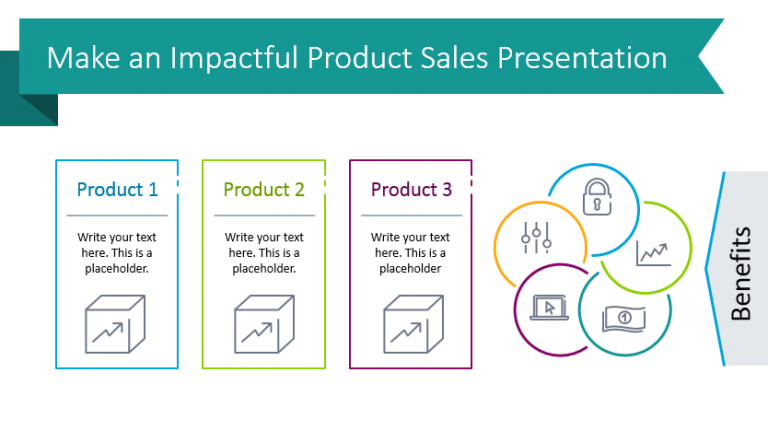
Do you need to prepare an impactful and convincing sales pitch? If you’re…

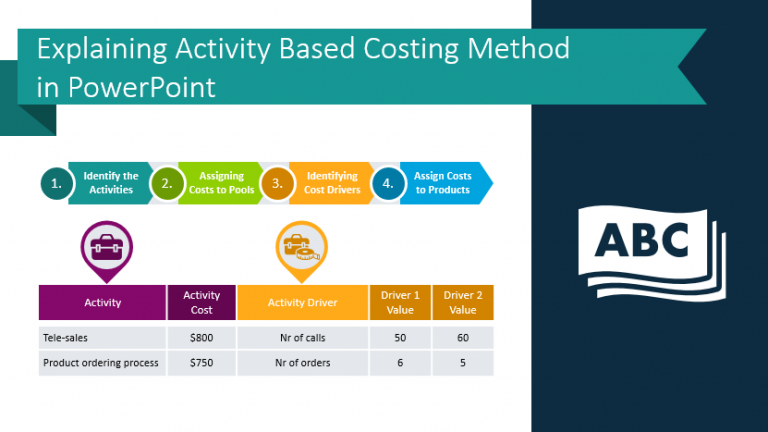
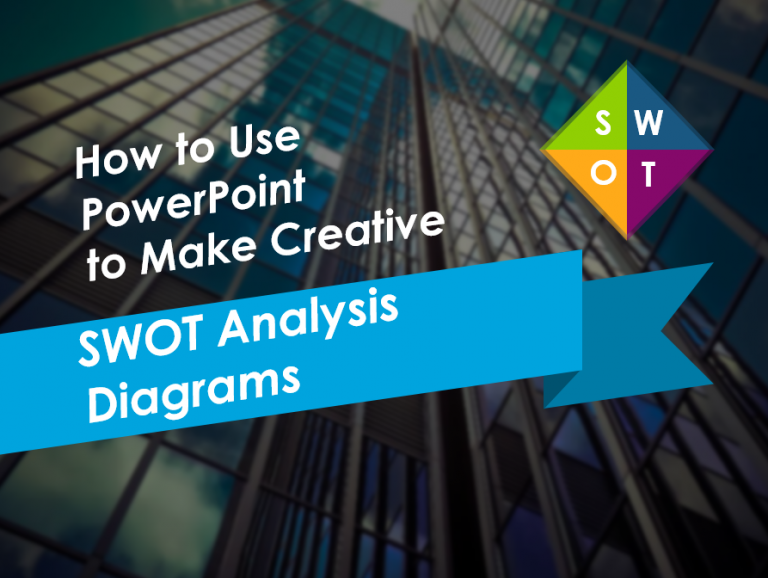
What is Root Cause Analysis, and how might it be helpful in your…
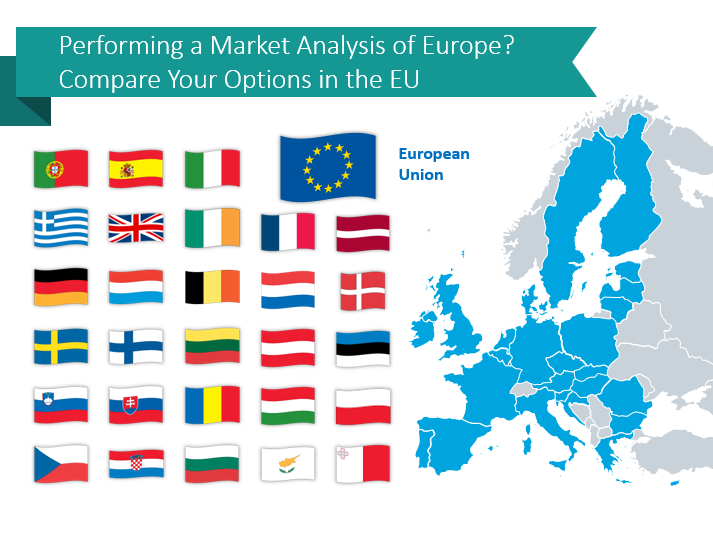
If your organization is debating or considering international expansion in the European continent,…
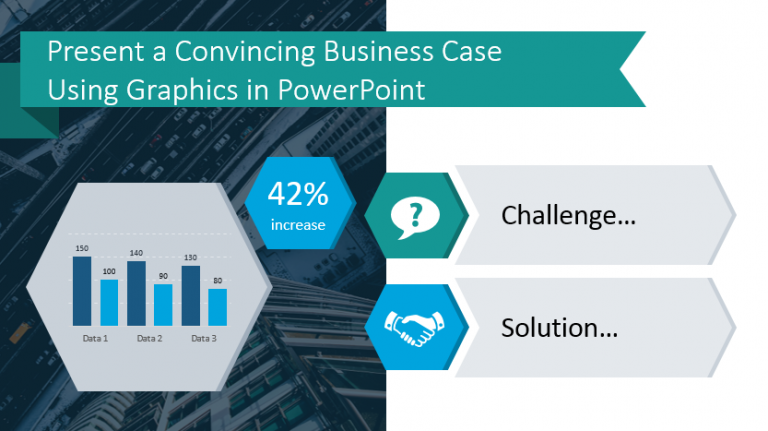
A business case study is fundamentally a story of challenges and proposing solutions…
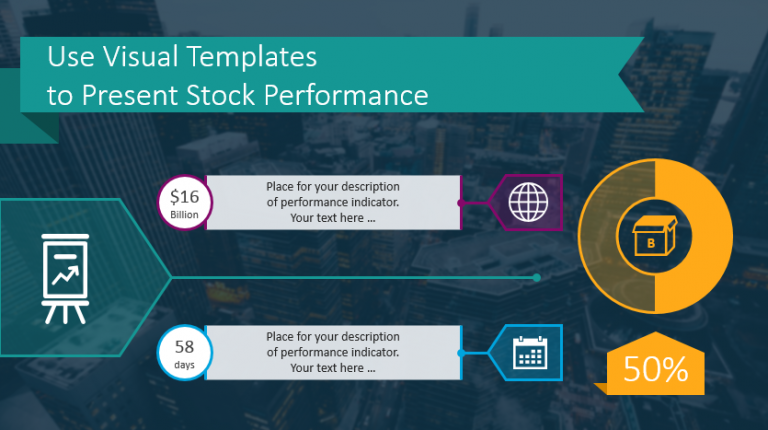
Are you presenting your company’s stock report performance? Use these basic components to…