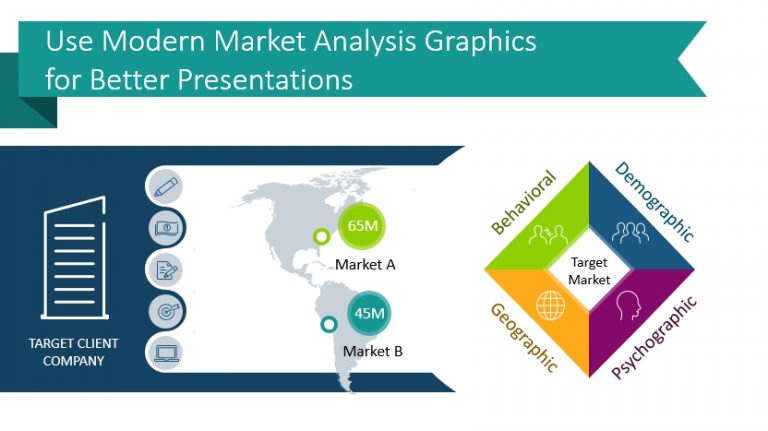
Use Modern Market Analysis Graphics for Better Presentations
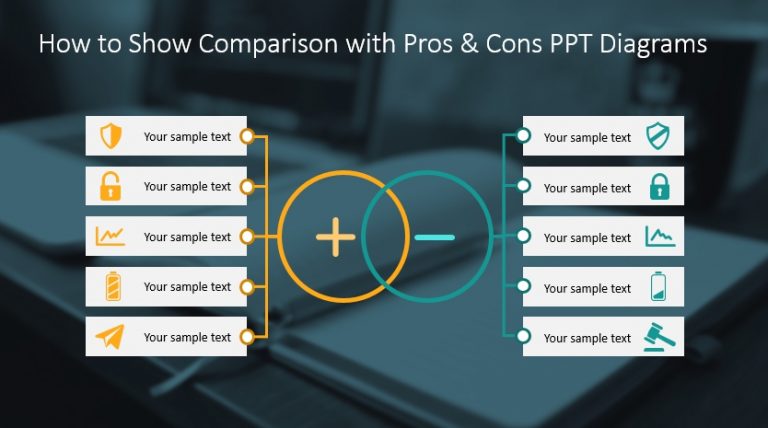
Presenting market research reports or market analysis? You can help your audience understand…
Graphical resources for any presentation and inspirational ideas on transforming the default slides into effective infographics. Read on to learn how you can make clear compelling presentations, and explain your ideas and concepts in an easy-to-grasp visual way.
Presenting market research reports or market analysis? You can help your audience understand…
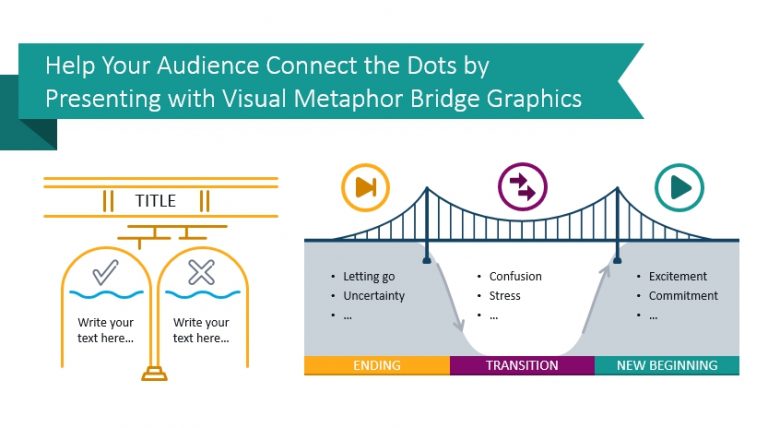
What do you think when you hear the phrase ‘bridge the gap’? This…
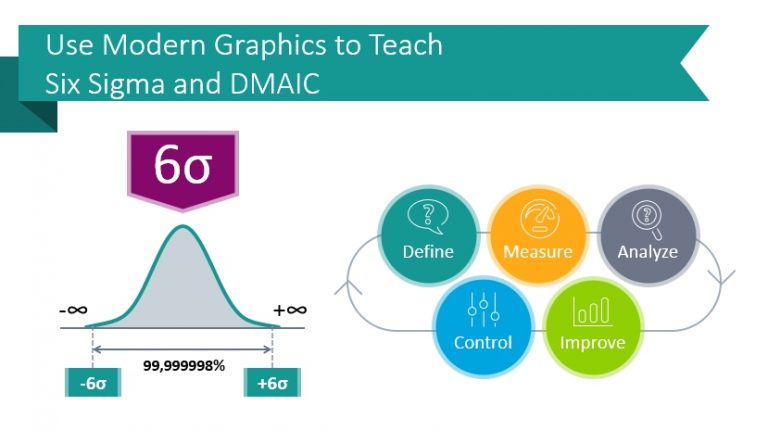
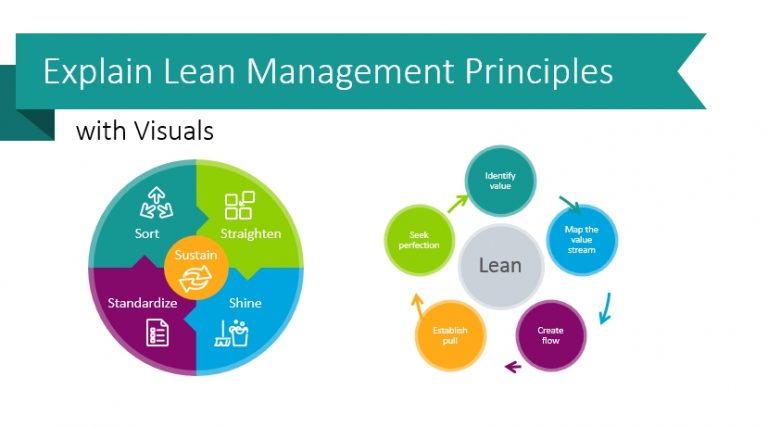
The Six Sigma framework was developed in the 80s by Motorola. The goal…
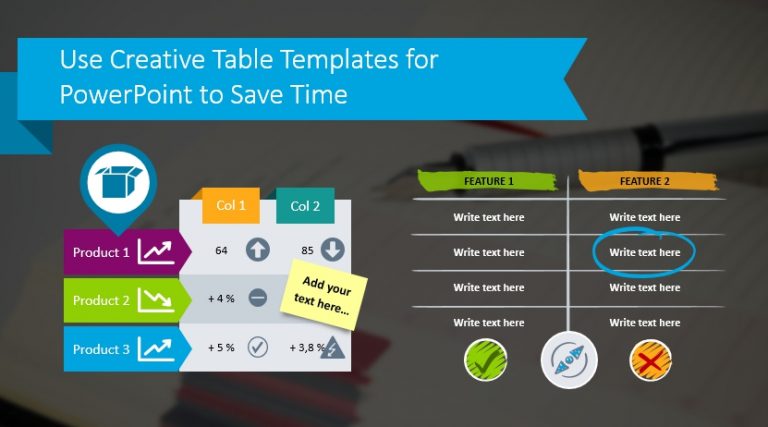
When making data-heavy presentations or sharing dense information, you may wish to use…
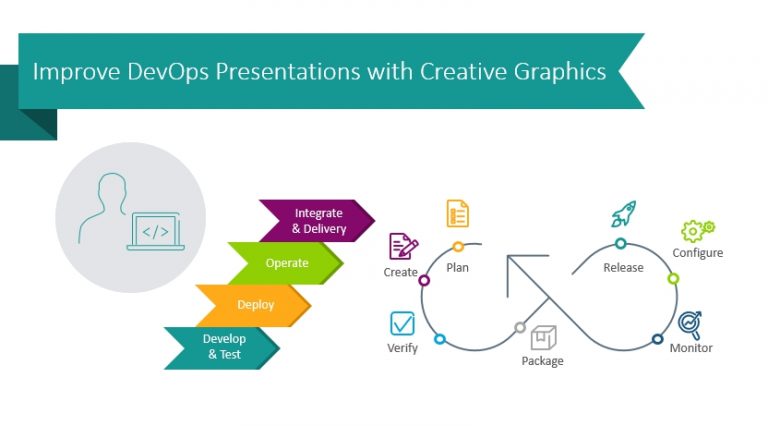
Explaining DevOps methodology concepts and processes can be challenging without the appropriate tools.…
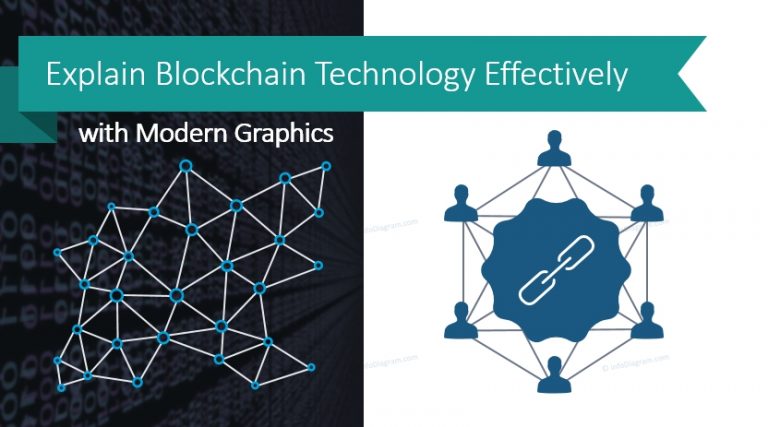
Defining concepts like distributed ledger, block structure, benefits and the applications of blockchain…
Have a presentation about organizational culture or values? Or looking for a way…