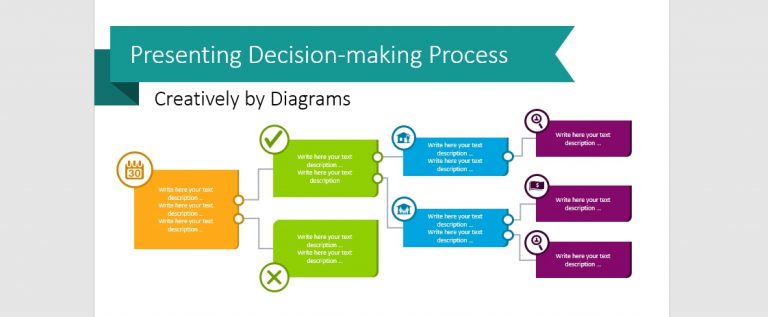
Present Decision-making Process Creatively With a Decision Tree Diagram
Need to present a business decision process, illustrate a legal procedure, or show…
Graphical resources for any presentation and inspirational ideas on transforming the default slides into effective infographics. Read on to learn how you can make clear compelling presentations, and explain your ideas and concepts in an easy-to-grasp visual way.
Need to present a business decision process, illustrate a legal procedure, or show…
At the end of the year, we’re all reporting. It may be not…
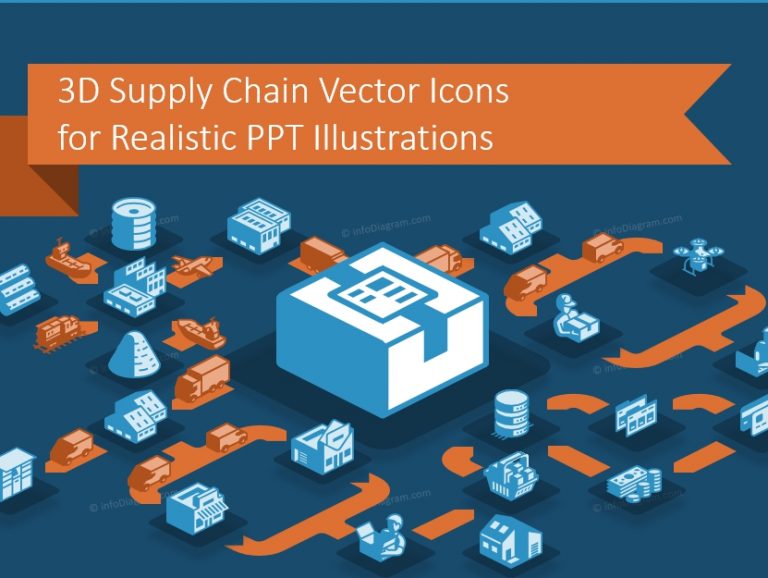
Why use 3D icons in a presentation? 3D logistics icons are useful for…

Wondering how to plan year activities the new way? If you are one…

Do you want to illustrate an HR process, employee engagement, or talent development…
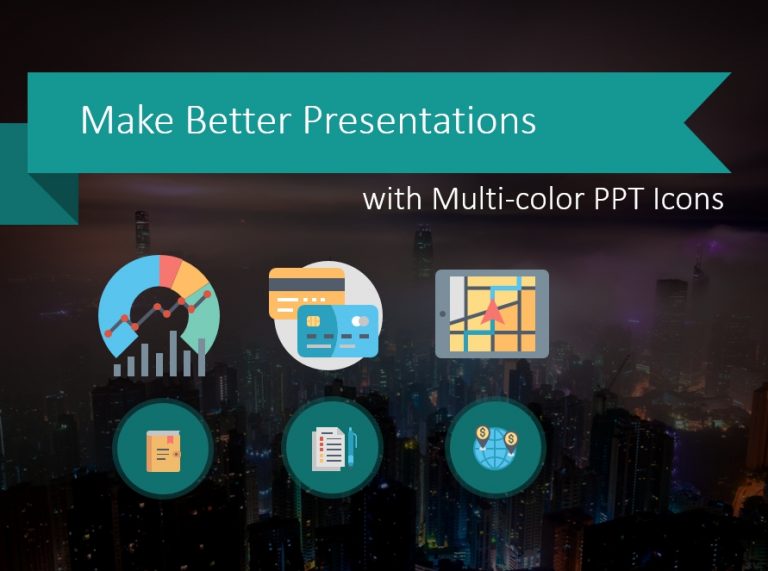
Every area of business can benefit from presentation graphics. You can use images…
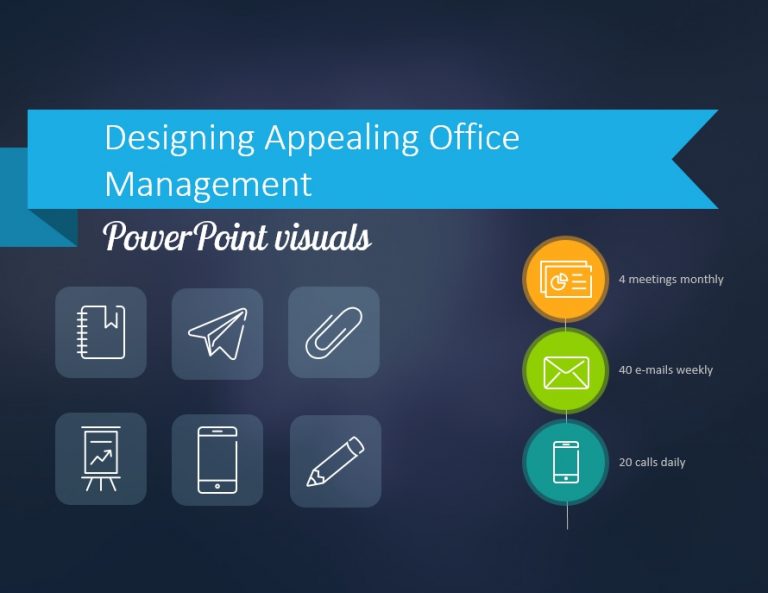
If you need to illustrate the office management tasks or documents processing check…
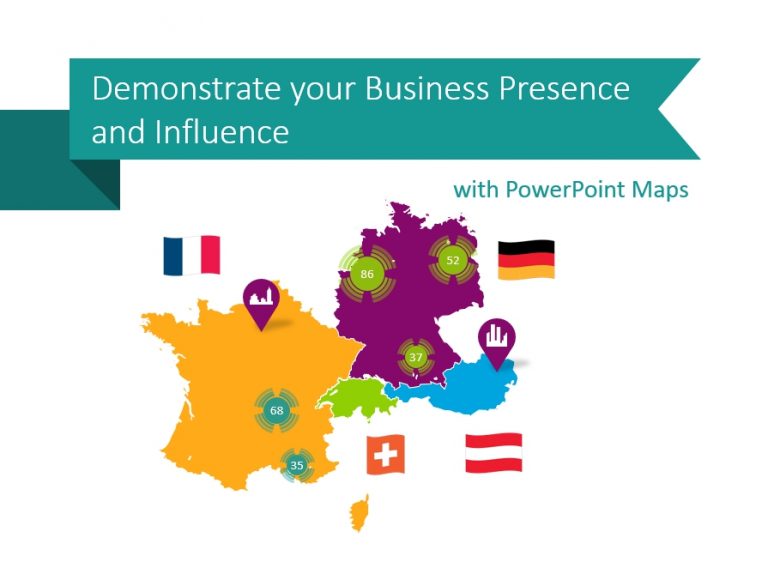
Express your company’s global reach with country map graphics Global businesses need to…
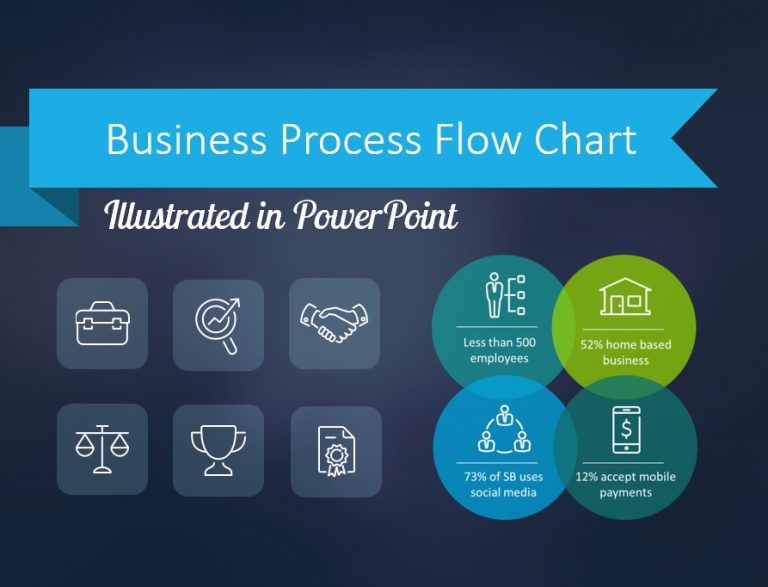
Presenting a business process or various information flow models in an organization are…
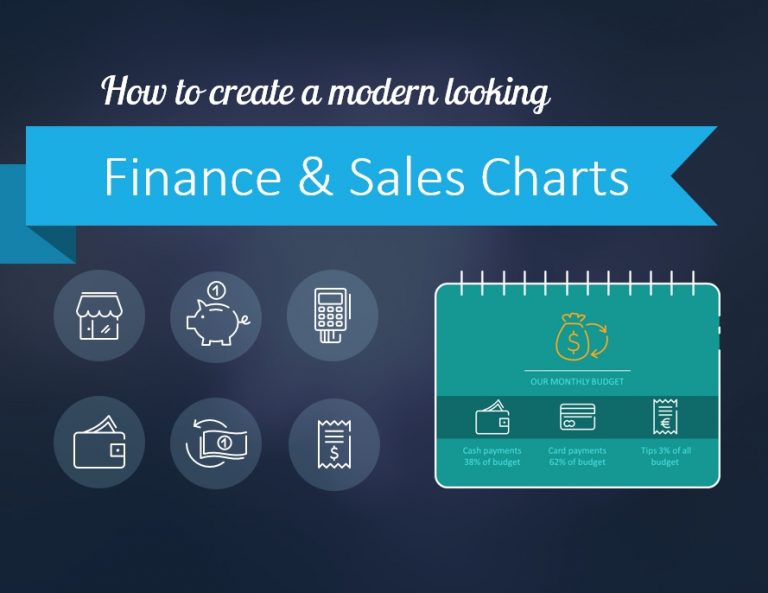
Preparing for a finance presentation? Or creating a sales chart for Your quarterly…