![How To Show Solution in a Presentation [concept visualization]](https://blog.infodiagram.com/wp-content/uploads/2020/08/solution-title-pic-big-768x428.png)
How to Illustrate Solution Idea in a Presentation [concept visualization]
Are you about to present several possible solutions to your team or clients?…
Are you about to present several possible solutions to your team or clients?…
Do you struggle to make your informative presentations interesting and engaging? If you…
![Presenting Communication in a Presentation[concept visualization]](https://blog.infodiagram.com/wp-content/uploads/2020/07/Communication-title-pic-768x428.png)
Do you need to illustrate the idea of interpersonal communication or feedback in…
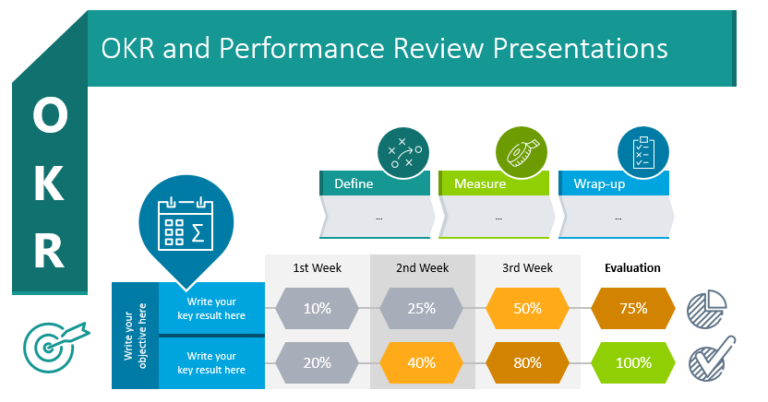
Does your organization conduct performance reviews? Probably so. Even if you don’t utilize…
![How to Illustrate Weakness in a Presentation [concept visualization]](https://blog.infodiagram.com/wp-content/uploads/2020/08/weakness-title-pic-big-768x428.png)
Do you need to talk about the idea of weakness in your presentation?…
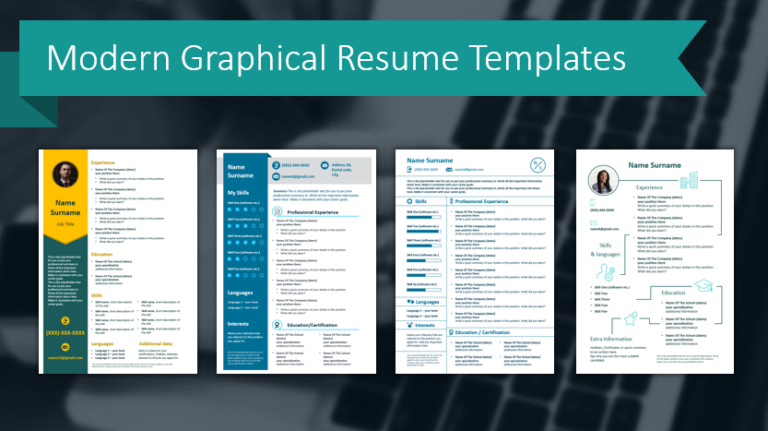
Do you want to stand out when job hunting? Then you need to…

Are you a healthcare provider or medical researcher? If you’ll be presenting on…
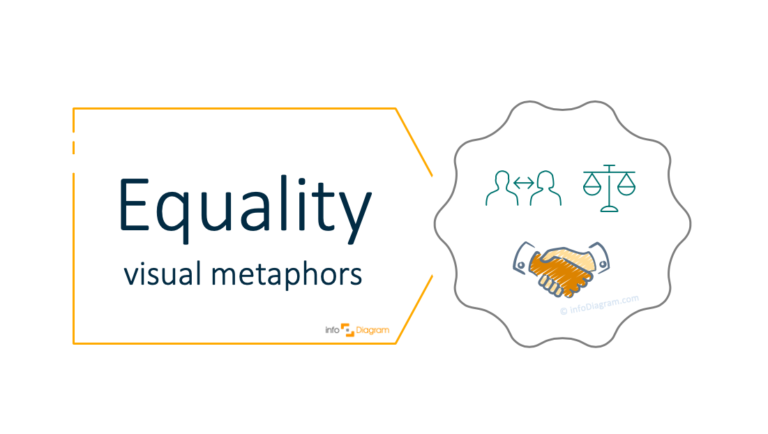
If you need to illustrate the equality concept, take a look at our…

Medical issues, whether they are diseases or other health conditions, can be complicated…
![Illustrating Strength in a Presentation [concept visualization]](https://blog.infodiagram.com/wp-content/uploads/2020/08/strength-title-pic-big-768x428.png)
Do you need to illustrate the idea of strength or strong side in…
With the development of technologies, e-learning and remote education became usual. If you…
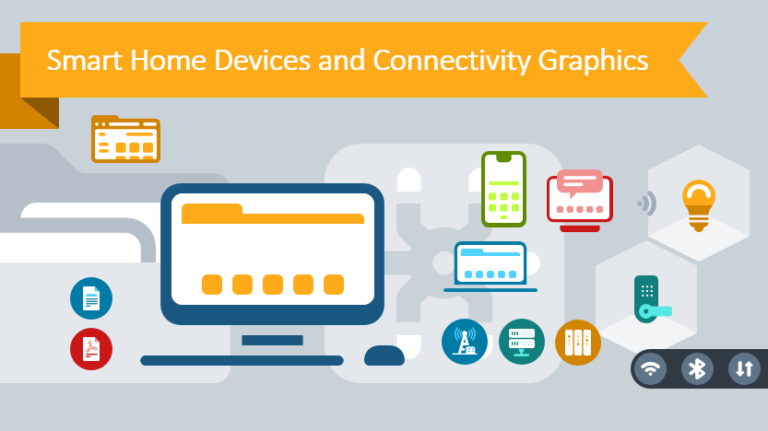
Do you need to present on Smart Home Devices and Connectivity topics? Creating…
If you need to illustrate the financial technology concept, online banking applications, etc, check…

Healthcare and medical advice materials and presentations need to look professional. Professionalism is…
If you work on a presentation where you want to illustrate a project…
Do you need to explain the motivation concept? Do you know some interesting…
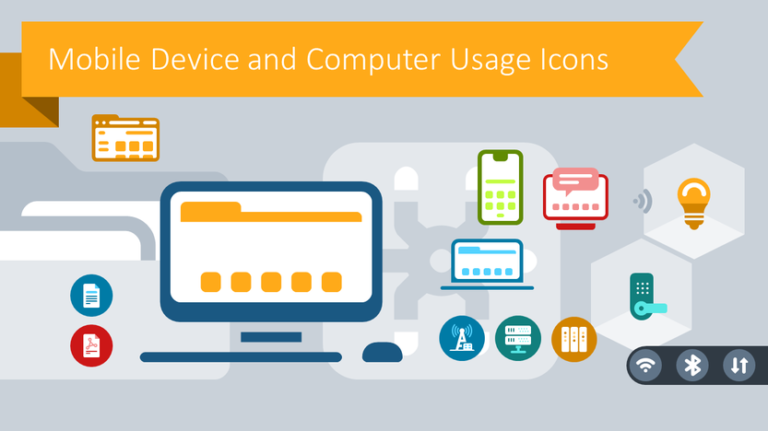
Mobile device and computer usage presentations don’t have to be boring. Whether you’re…
Social, employee, or customer engagement. Do you need to talk about any engagement…
Problems, obstacles, or challenges sound for you too abstractly? In this blog, with…

Healthcare and medical professionals report familiar struggles with presentations. Those in healthcare, including…