New way of getting single slide – Subscription Plans [news]
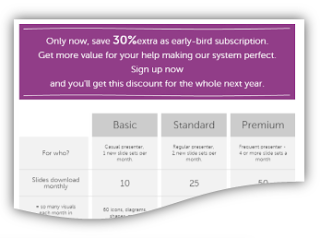
Today we are happy to have the first subscribers using the system. Here…
Today we are happy to have the first subscribers using the system. Here…
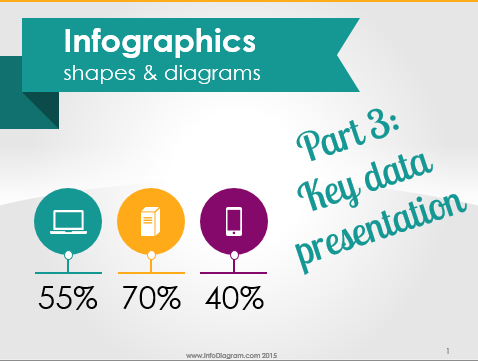
Are you presenting some important data values on a slide? KPI numbers, company…
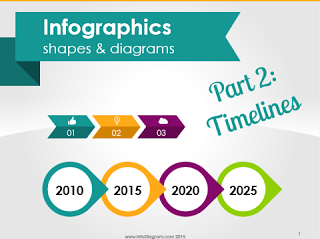
Are you presenting timeline or time sequence information? It can be a process…
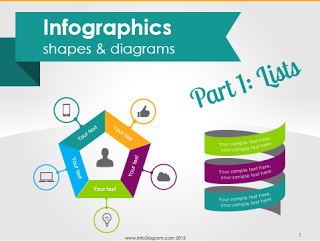
Do you have a classical bullet point text slide with a list of…
This is a continuation of part I. In the previous post I have…
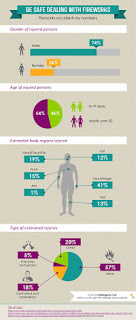
Surely you have seen many great infographics. Want to create your own? Never…
Here’s an example of how our icons were applied for a presentation made…
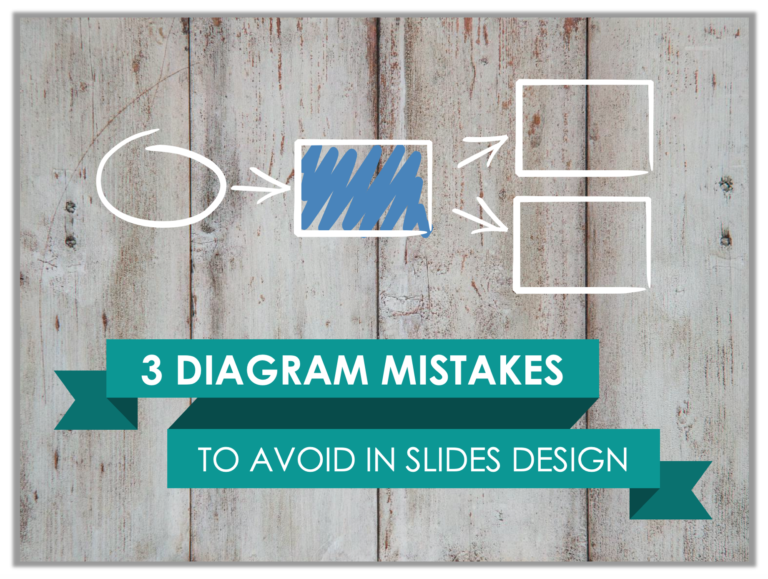
Chances are you have used some diagrams or workflow schema in your presentation,…

Last month infoDiagram turned three years old since our full service. And it’s…
We have been putting together visual slides for our colleague Marcin, some time…
Looking at our previous posts, you could see we were not blogging too…
One reason so few of us achieve what we truly want is that…
Have you ever been to a conference, where you felt lost in the…

Have you ever wondered how we create our handwritten style and shapes in…
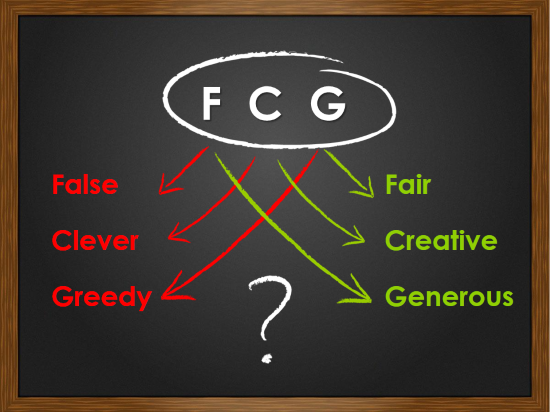
A few weeks ago I was designing slides for an interesting motivational speech,…
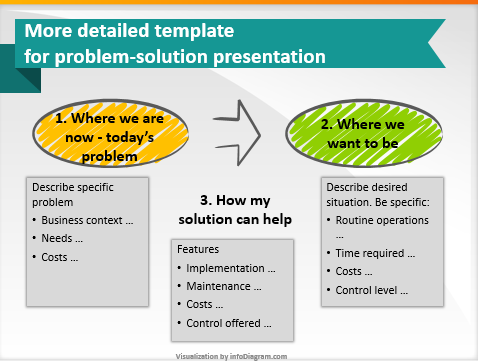
Imagine a situation – you are working on a presentation, you know your…
Here I share example of illustrating the main message of Seth Godin’s blog…
This is an another practise of using visual thinking to extract the essence…
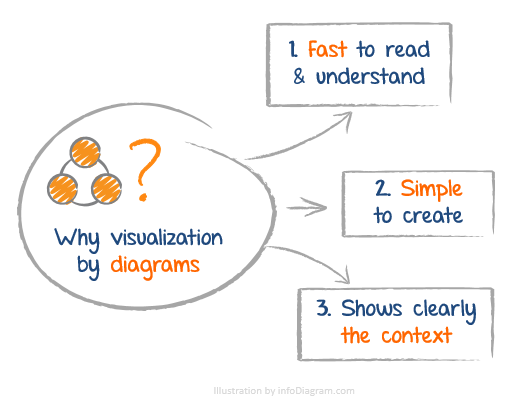
Here’s a simple diagram sketch of excellent Seth Godin’s blog “What’s the use…