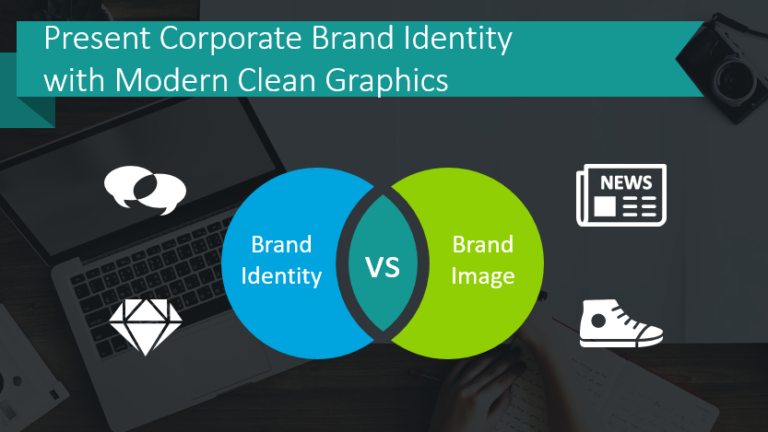
Present Corporate Brand Identity with Modern Clean Graphics
Do you need to share or explain your Brand Identity? Whether you need…
Do you need to share or explain your Brand Identity? Whether you need…
Providing visual clarity is essential, even when utilizing creative graphics. You can benefit…
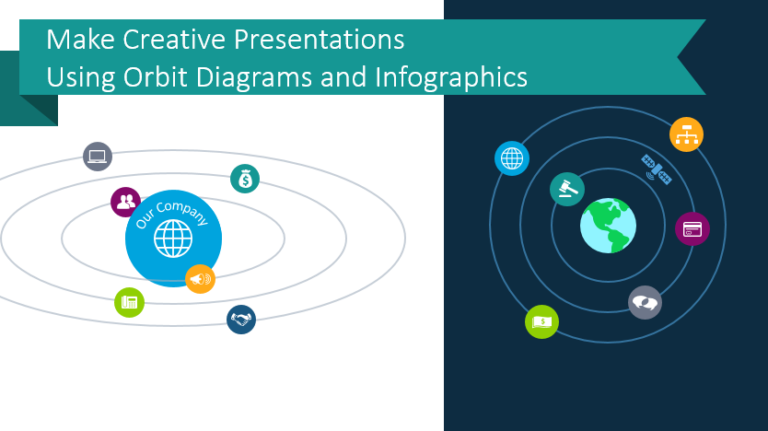
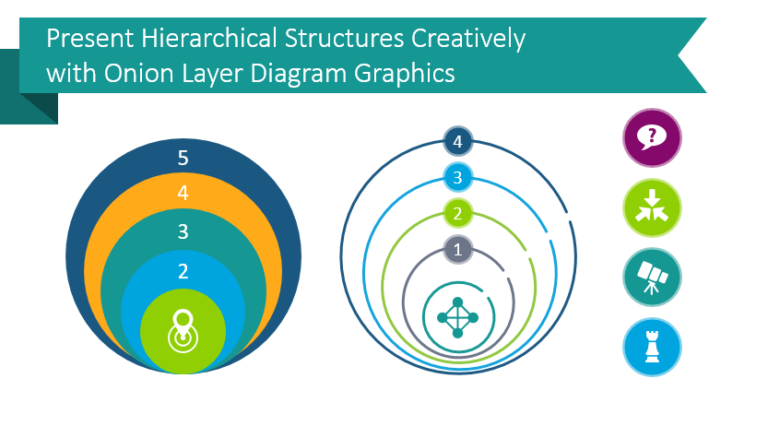
Do you have to present a topic with one central theme or element?…
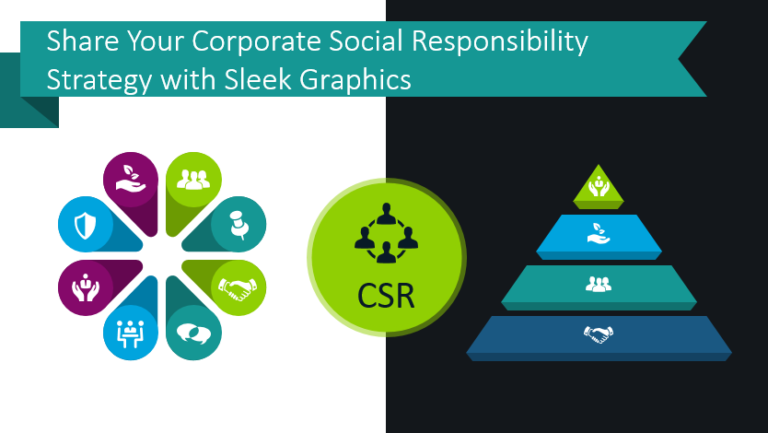
Is your company or organization focusing on CSR? If so, you can present…
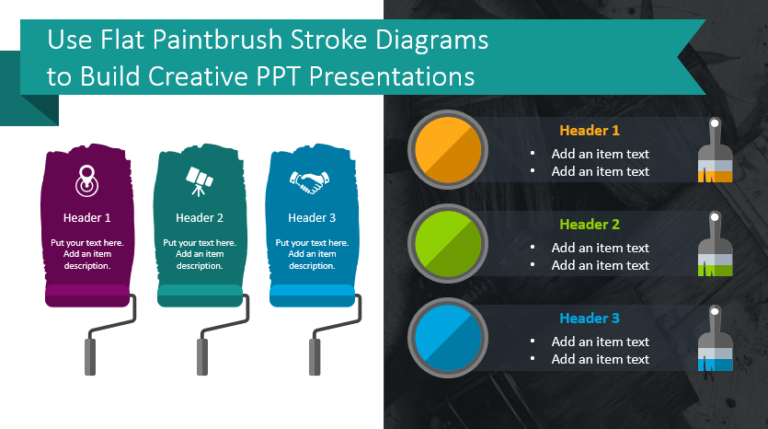
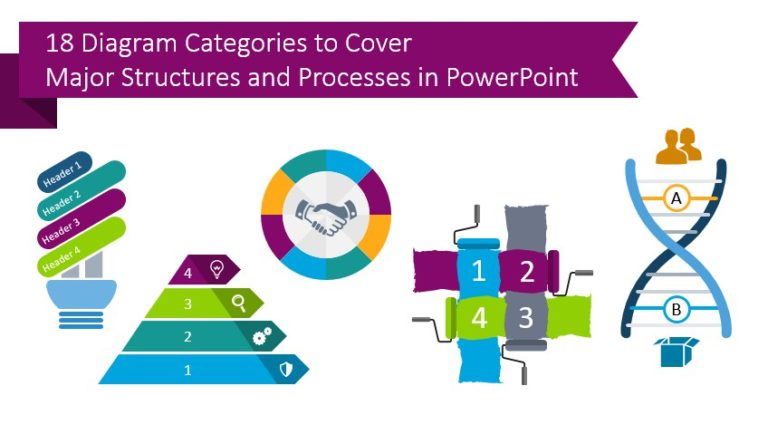
Do you wish you could present the listed information in an interesting way?…
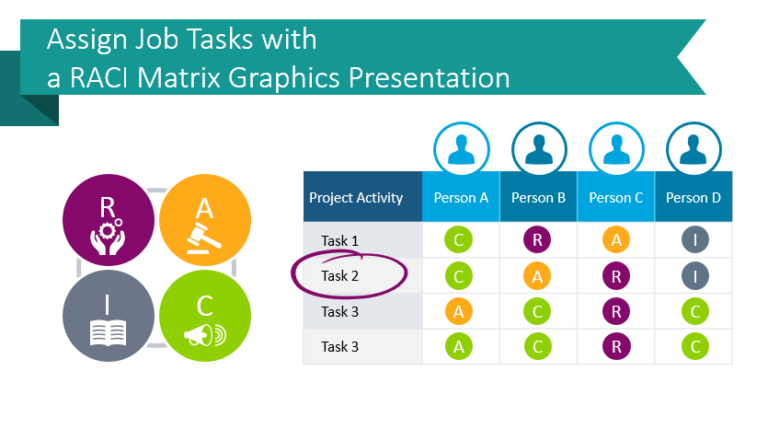
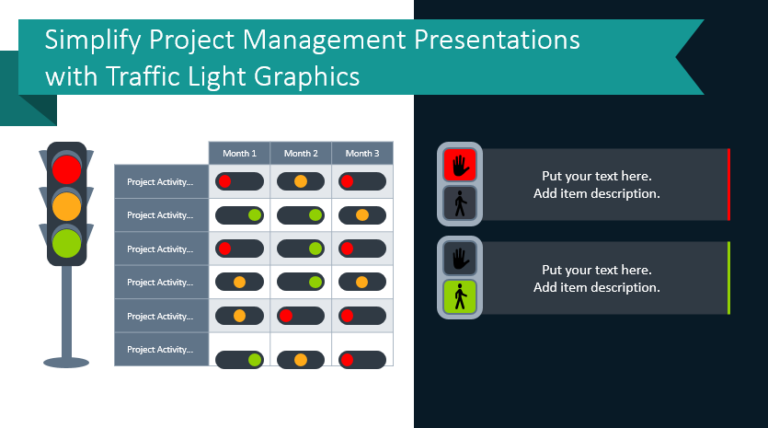
Giving project management presentations is difficult. How can you keep your audience engaged…
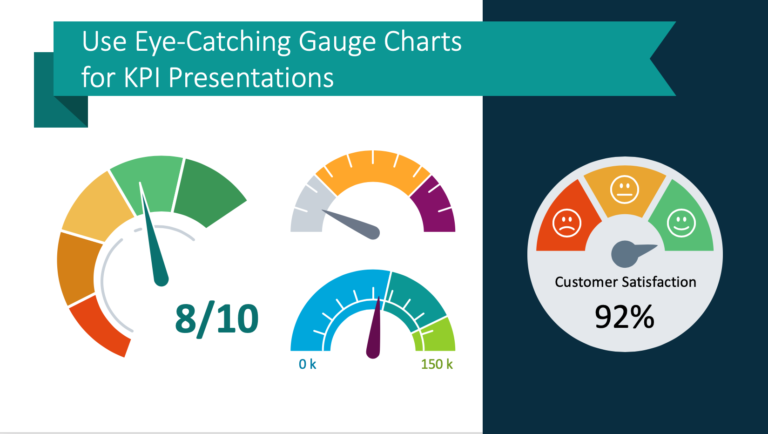
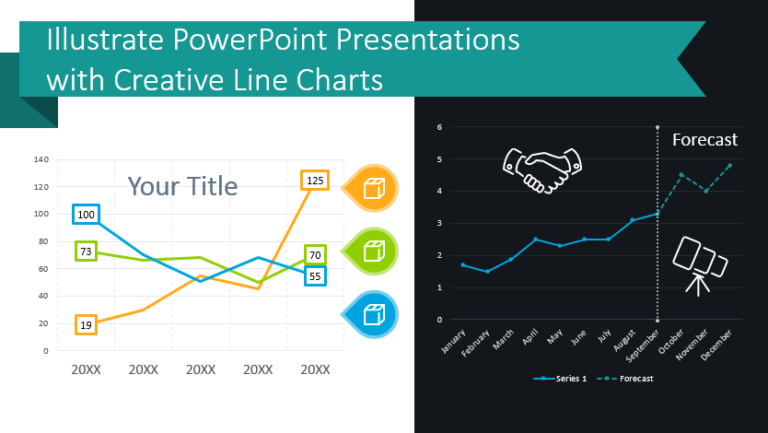
Are you presenting a data-heavy topic? If you are presenting sales trends or…
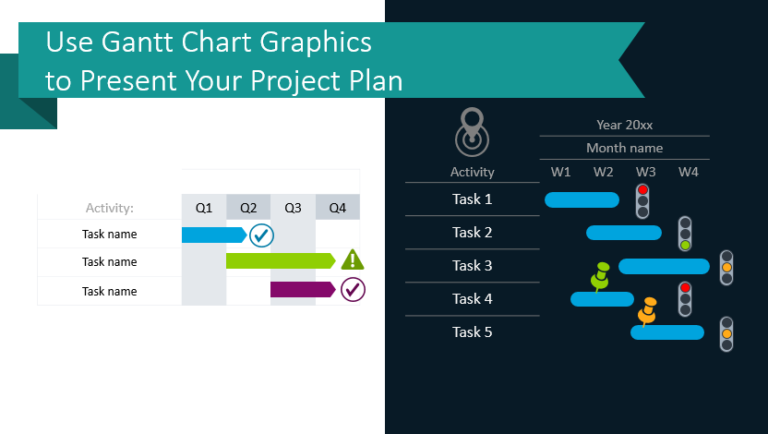
You want to present your project plan because it makes it easier to…
It’s this time of the year… Time to make plans! If you’re about…
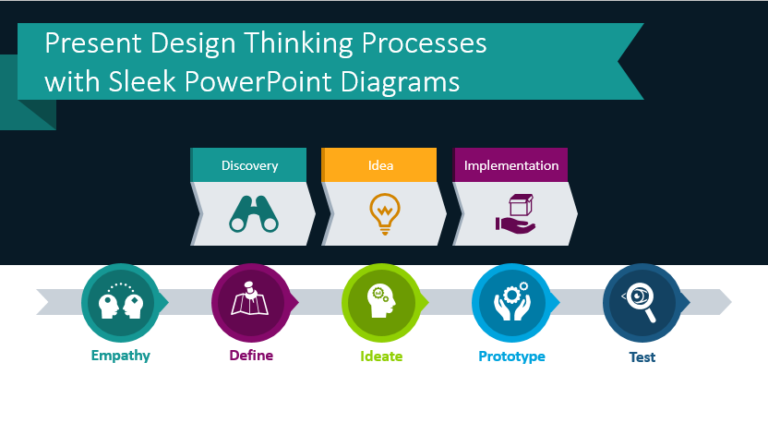
Do you use the design thinking process in or on behalf of your…
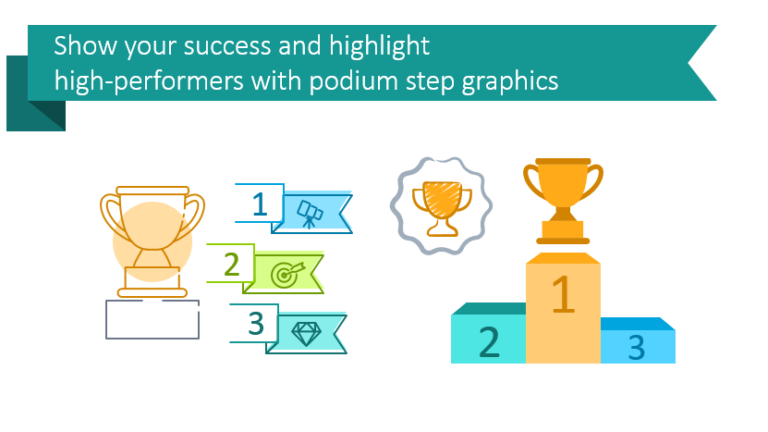
Want to present your top performers or share which products sold the best…
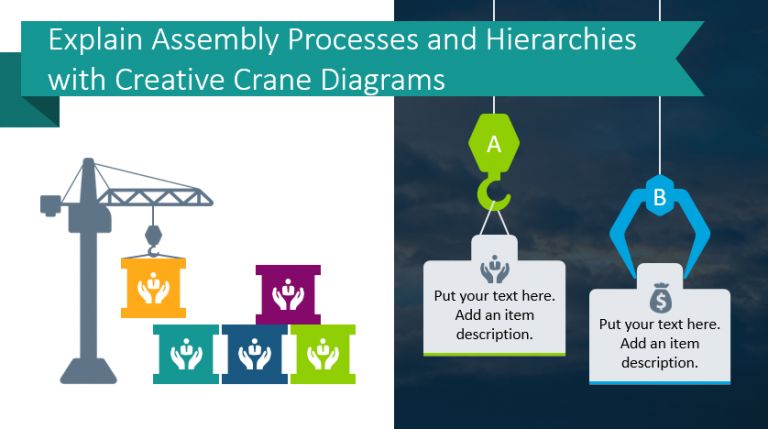
Are you presenting a process that splits into 2 or more elements? Don’t…
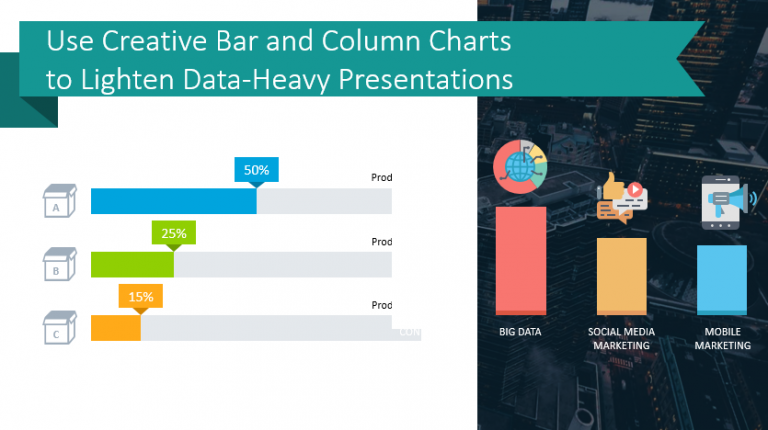
Is your next presentation containing a bunch of small graphs, default column chart…
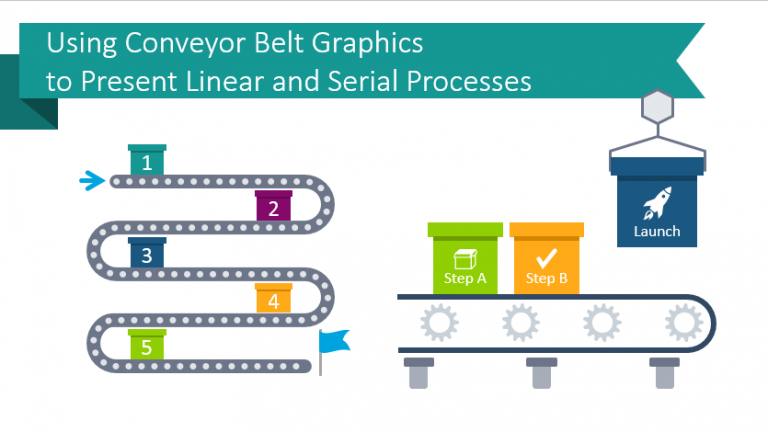
Presenting a set of steps or a sequential process? Need to explain a…
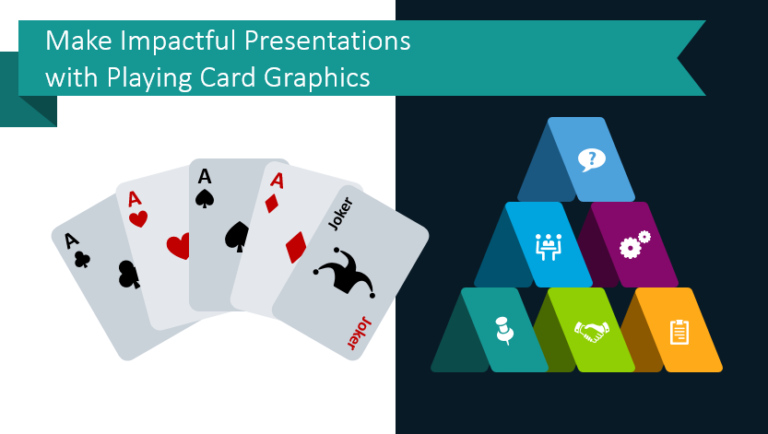
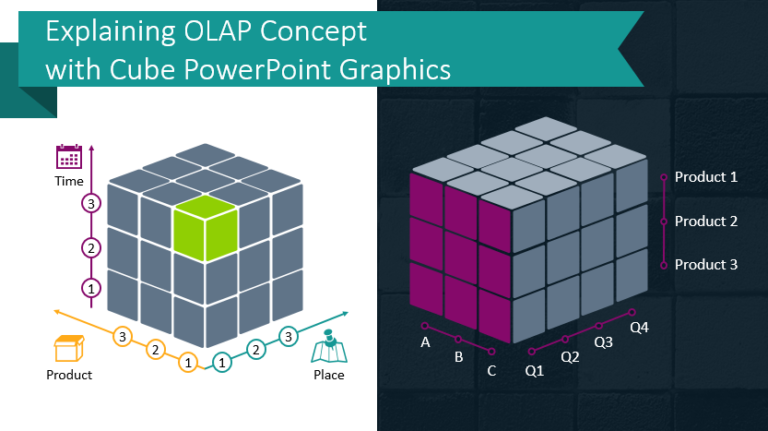
Creating visuals for abstract ideas is challenging. Do you wish you could present…