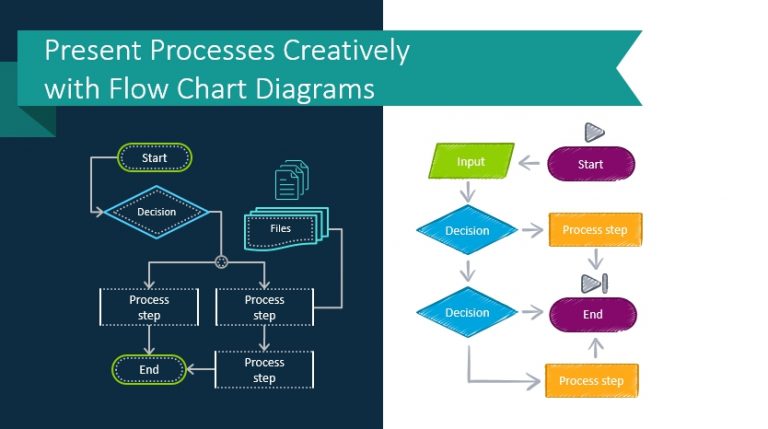
Present Processes Creatively with Flow Chart Diagrams
Presenting processes and algorithms is tough. Getting your audience to understand your message…
Presenting processes and algorithms is tough. Getting your audience to understand your message…
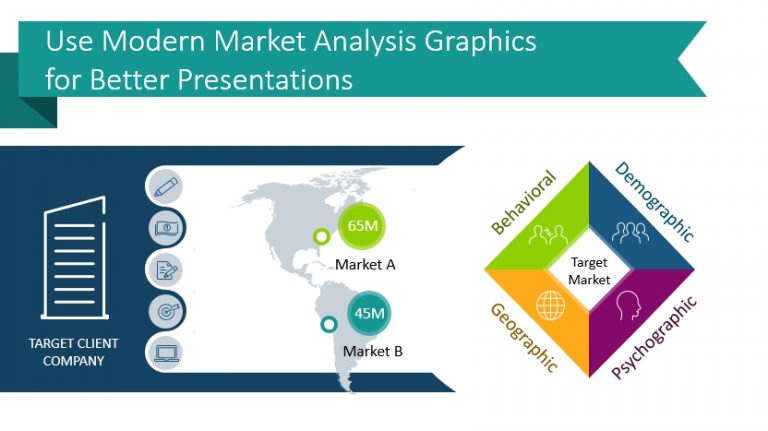
Presenting market research reports or market analysis? You can help your audience understand…
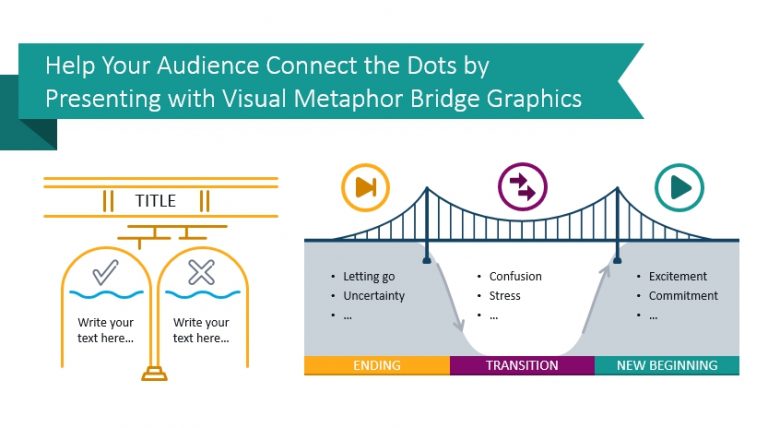
What do you think when you hear the phrase ‘bridge the gap’? This…
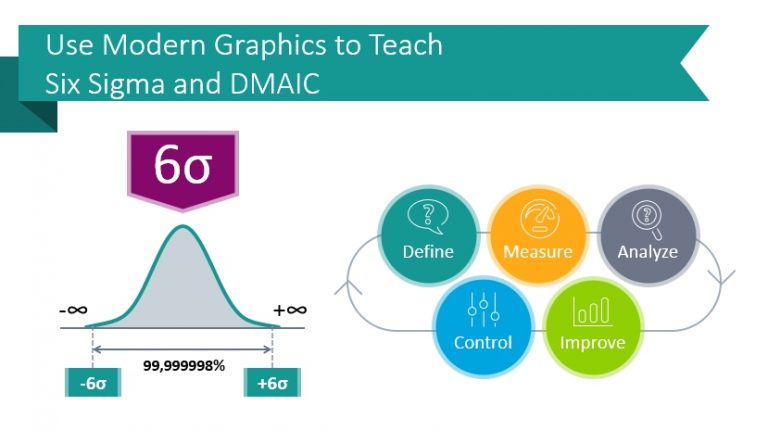
The Six Sigma framework was developed in the 80s by Motorola. The goal…
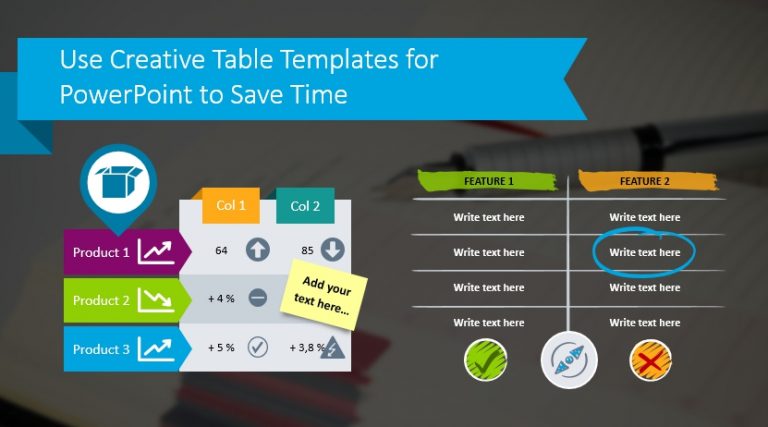
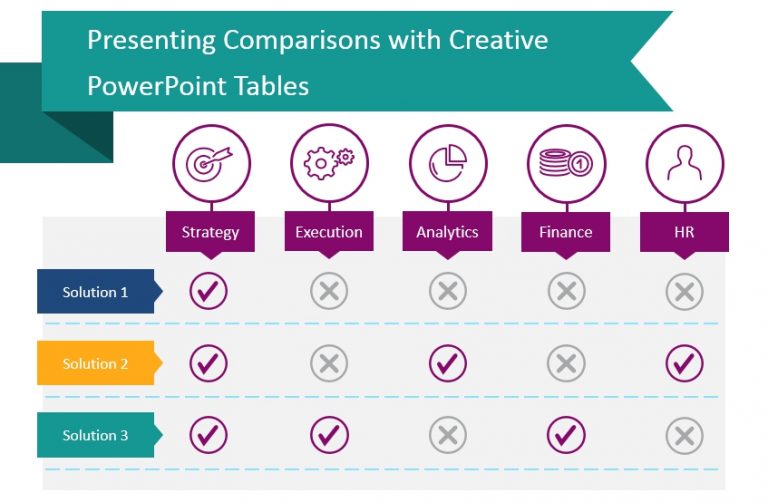
When making data-heavy presentations or sharing dense information, you may wish to use…
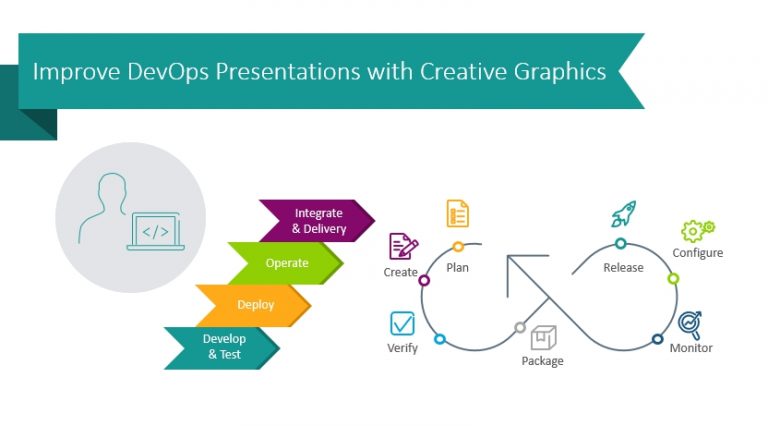
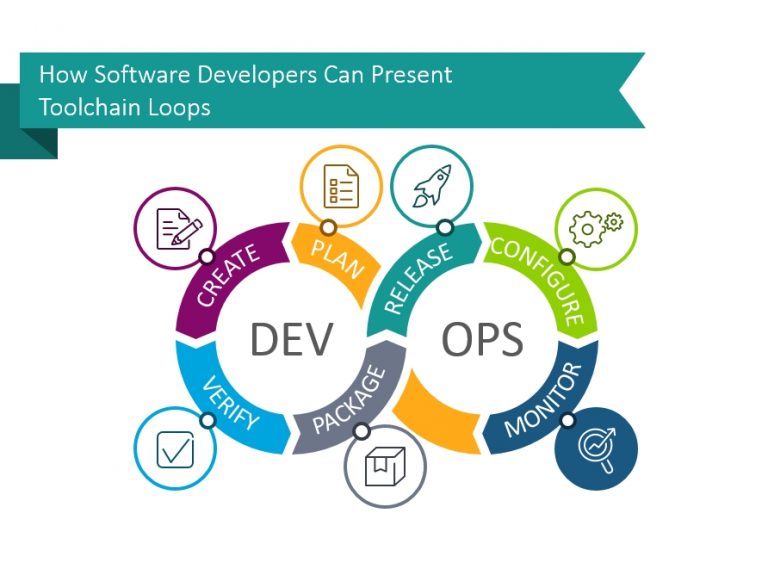
Explaining DevOps methodology concepts and processes can be challenging without the appropriate tools.…
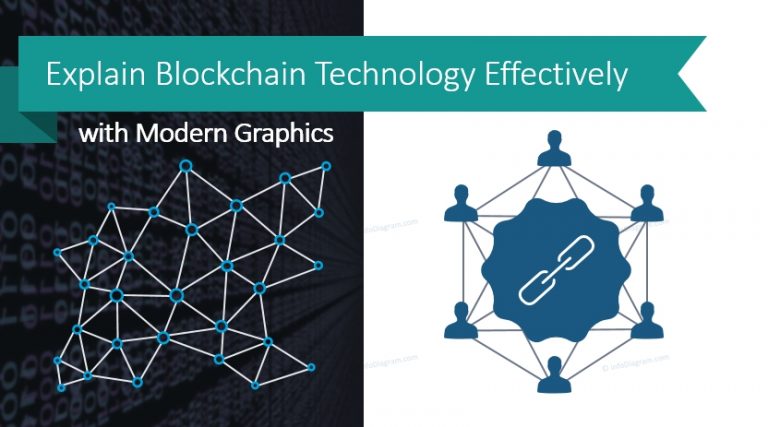
Defining concepts like distributed ledger, block structure, benefits and the applications of blockchain…
Have a presentation about organizational culture or values? Or looking for a way…
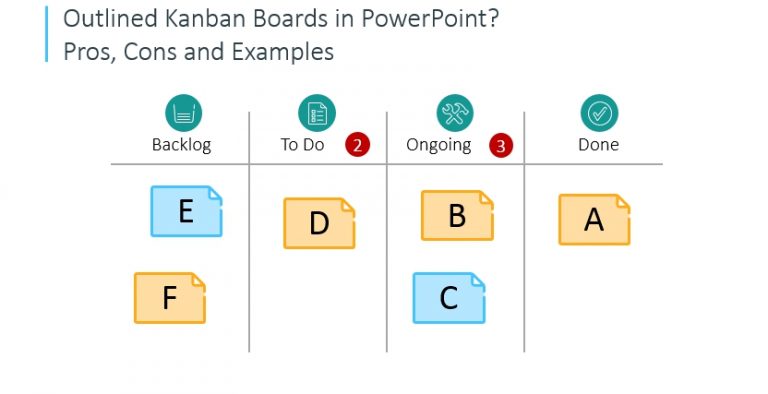
The essence of the Kanban approach to agile project management lies in using…
When working in software development management, you may need to present the frameworks…
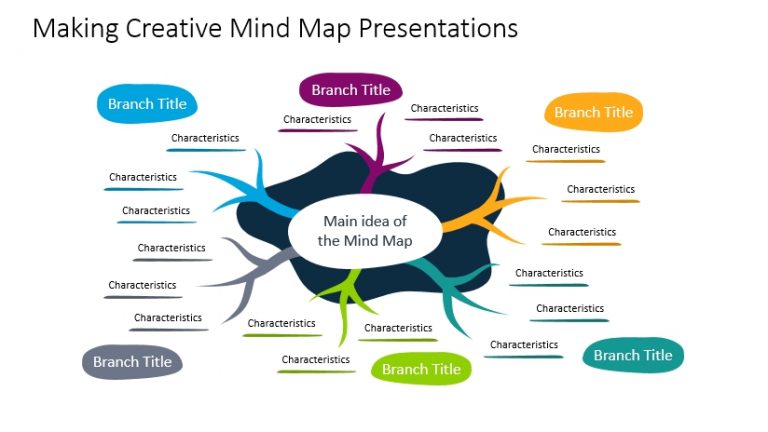
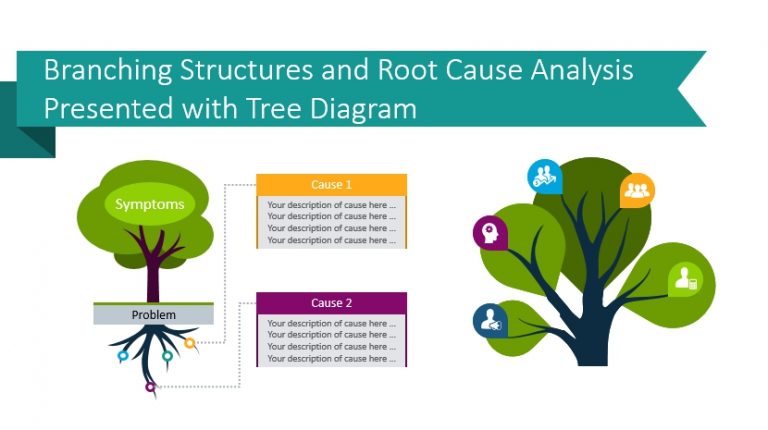
Developing and sharing ideas, complex ones can be difficult. When presenting it to…
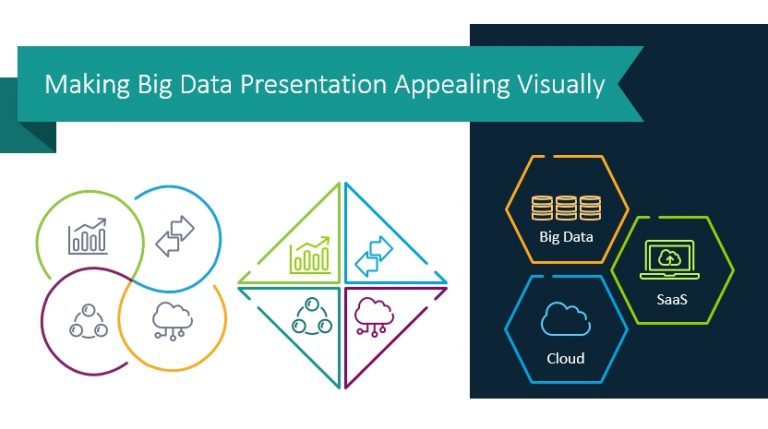
Are you about to present Big Data or other modern cloud-based IT technologies?…
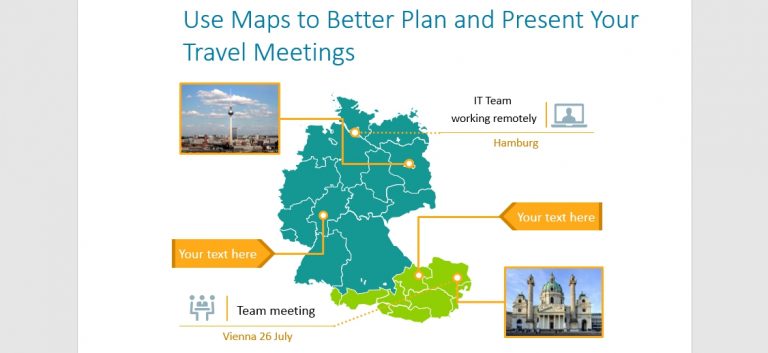
International travel can easily be illustrated with PowerPoint maps and other graphics. You…
You can use chevron timeline diagrams to present your progress on a project…
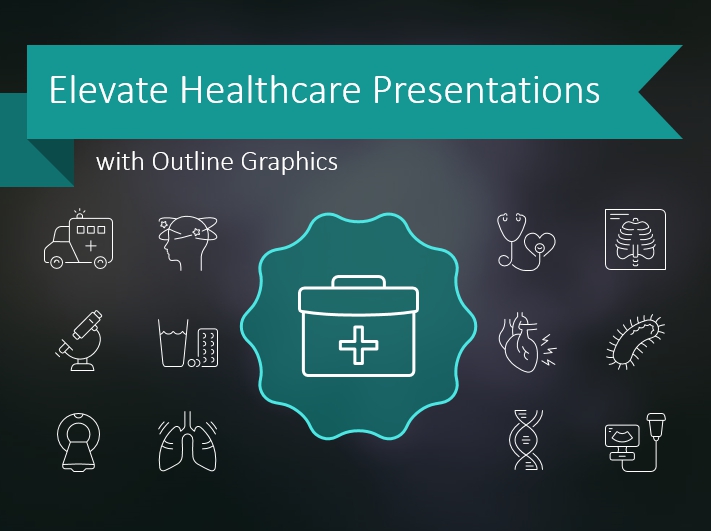
Visual appeal is essential for attention-grabbing not only in medical presentations If you…