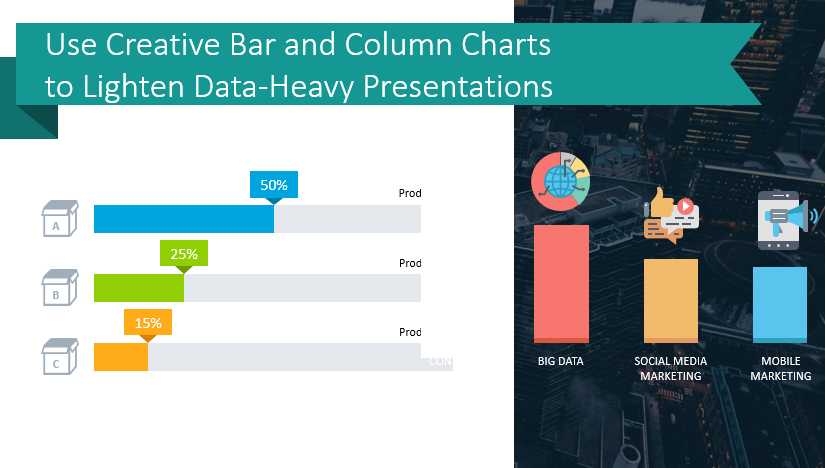
Is your next presentation containing a bunch of small graphs, default column chart diagrams and tables? All stuck together on one slide? Then you’re suffering a data-heavy slide symptom.
Continue reading Use Creative Bar and Column Chart Templates to Lighten Data-Heavy Presentations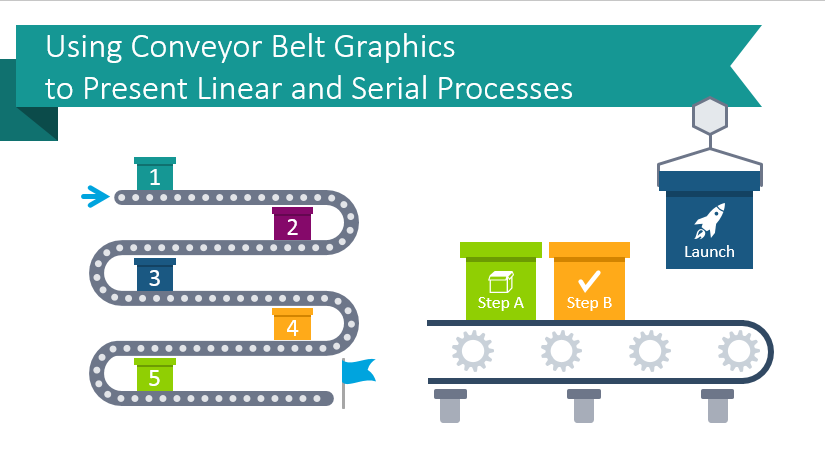
Using Conveyor Belt Graphics to Present Linear and Serial Processes
Presenting a set of steps or a sequential process? Need to explain a product launch, or want to create a creative, unique visual for timelines and flow charts? Visual conveyor belt metaphors are great for helping to explain multi-stage or multi-phase processes. Such linear flows and procedures – they can all easily be explained with creative imagery.
Continue reading Using Conveyor Belt Graphics to Present Linear and Serial Processes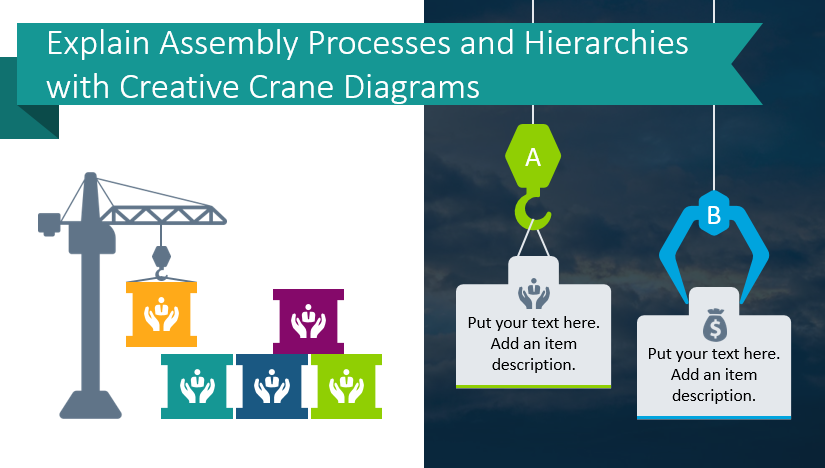
Explain Assembly Processes and Hierarchies with Creative Crane Graphics
Creating visuals for abstract ideas is challenging. Do you wish you could present more cohesively? If you’ve struggled to illustrate the transition between tasks “to do” and those which are done, crane graphics and diagrams may be what you need.
Continue reading Explain Assembly Processes and Hierarchies with Creative Crane Graphics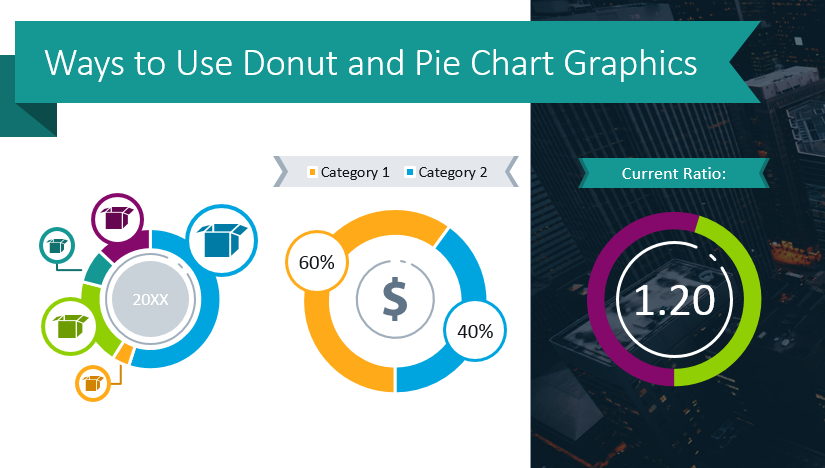
Ways to Use Donut and Pie Chart Graphics
You are probably familiar with pie charts. Pie chart graphics are great for representing numerical values that comprise a whole. Pie charts are wonderful for when you need to show rough proportions of a few categories which total 100%.
Continue reading Ways to Use Donut and Pie Chart GraphicsHow to Use Branching Arrow for Creating Flow Chart Diagrams
Do you need to explain a process which splits into three or more elements? You can easily accomplish this goal with PowerPoint graphics. If you’ve tried to draw arrow shapes manually, then you know it’s difficult to create sleek, elegant curved shapes quickly. We knew it would be much easier to show a flow chart which forks with pre-designed branching arrow shapes.
Continue reading How to Use Branching Arrow for Creating Flow Chart Diagrams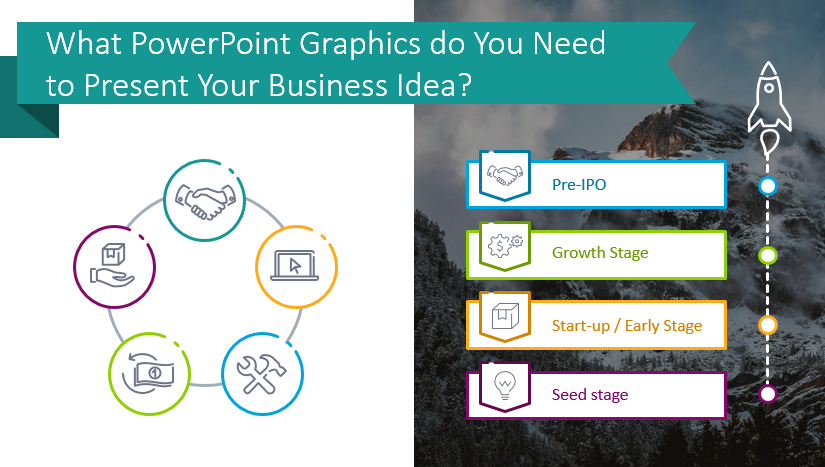
What Graphics do You Need to Pitch Your Business Idea?
Will you be making a light pitch or business presentation soon? If you need to secure funds or additional resources for a project you will need to make a compelling presentation. Elegant visuals can aid that purpose. Whether you build your own graphics or use our investor pitch deck, you will need modern, professional icons.
Continue reading What Graphics do You Need to Pitch Your Business Idea?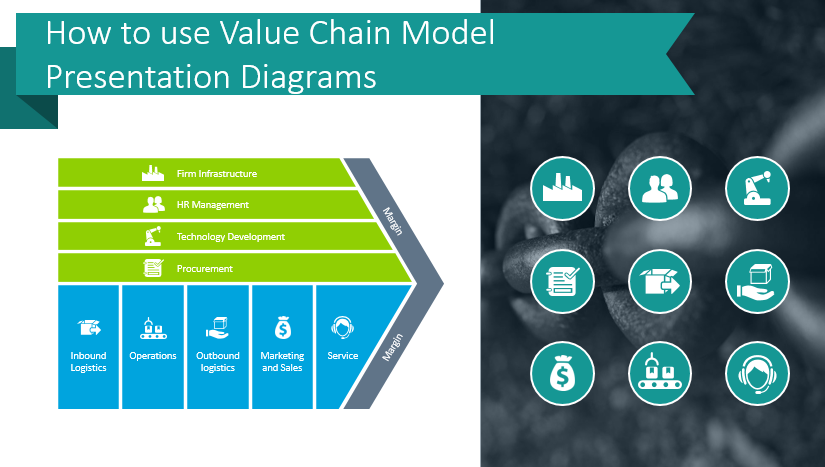
How to use Value Chain Model Presentation Diagrams
Do you need to explain the value chain model? If you’re conducting business using the value chain model, you can do so with visuals. Flow charts can be immensely helpful when breaking down the value chain consulting approach. Explain how the value chain model serves to evaluate company activities which deliver a product or service directly to the end client.
Continue reading How to use Value Chain Model Presentation Diagrams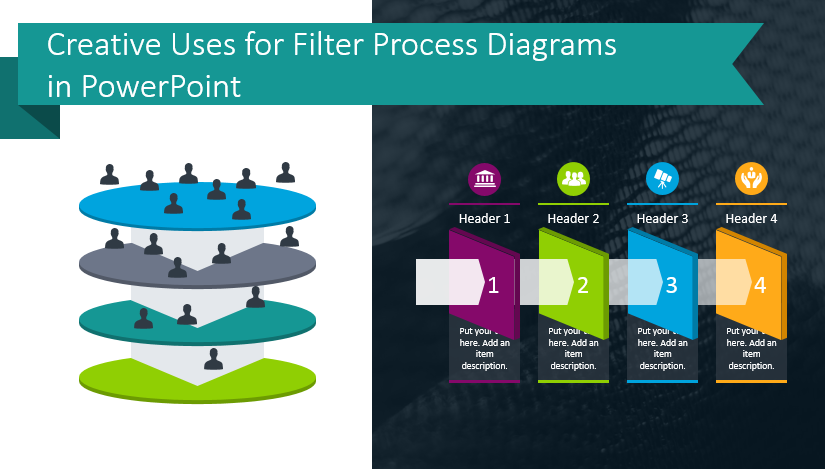
Creative Uses for Filter Process Diagrams in PowerPoint
Do you need to present or explain your client selection process or recruitment processes? Filter process diagrams are meant to illustrate the different stages of sales and marketing. They make it easier to present a large amount of information. The structured way information is presented will help your audience understand your message.
Continue reading Creative Uses for Filter Process Diagrams in PowerPoint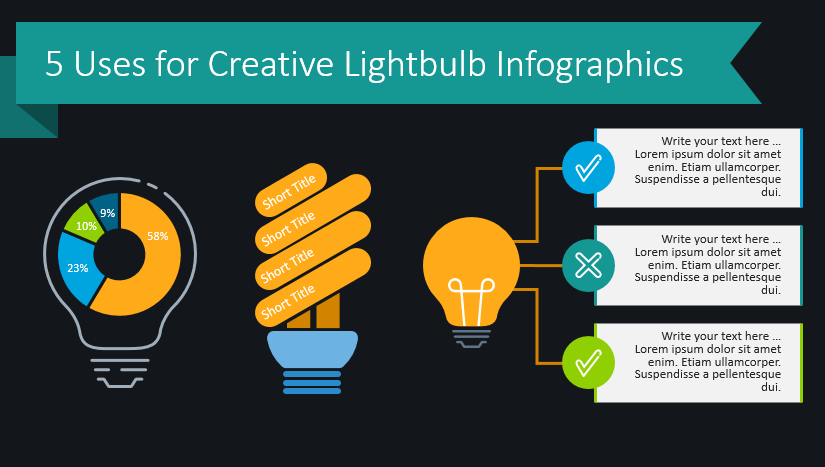
5 Uses for Creative Light Bulb Graphics
Do you need to express your bright ideas, creativity, or innovations in a presentation? If so, lightbulbs may be an appropriate visual metaphor. What creative idea or concept might your audience benefit from? With light bulb graphics, you can highlight new ideas or make lists with greater impact.
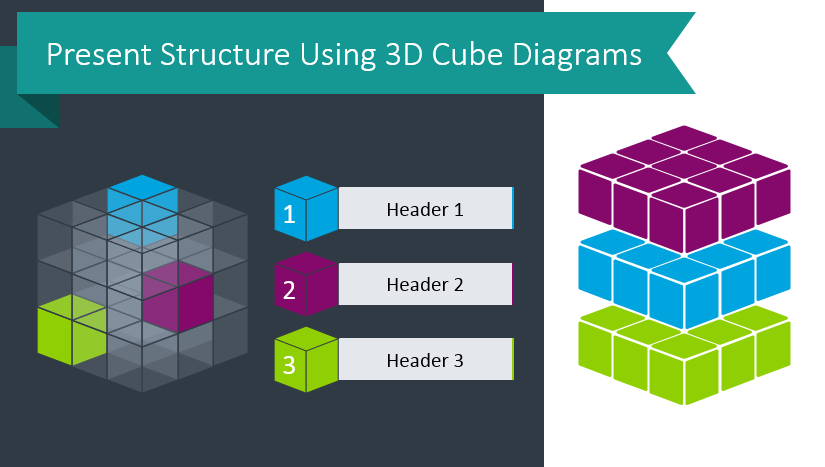
Present Structure Using 3D Cube Diagrams
3D cube graphics are useful visuals. They serve as shorthand for complexity but also order and structure. 3D diagrams can be useful when presenting spatial locations or describing multidimensional relationships.
Continue reading Present Structure Using 3D Cube Diagrams