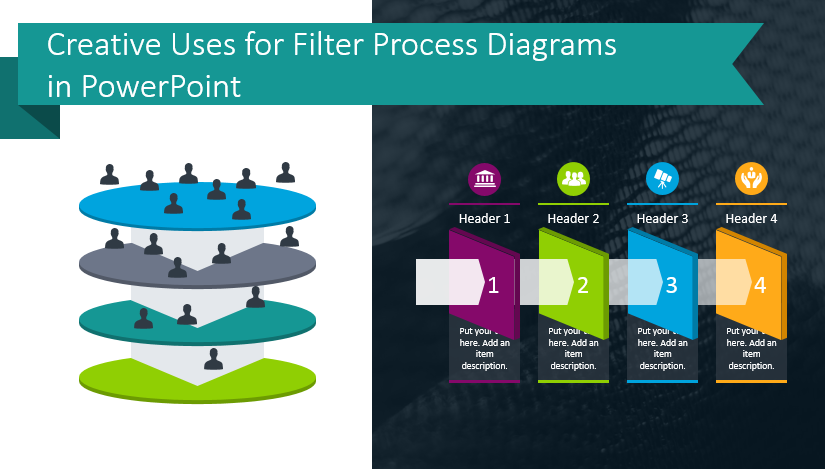
Do you need to present or explain your client selection process or recruitment processes? Filter process diagrams are meant to illustrate the different stages of sales and marketing. They make it easier to present a large amount of information. The structured way information is presented will help your audience understand your message.
Continue reading Creative Uses for Filter Process Diagrams in PowerPoint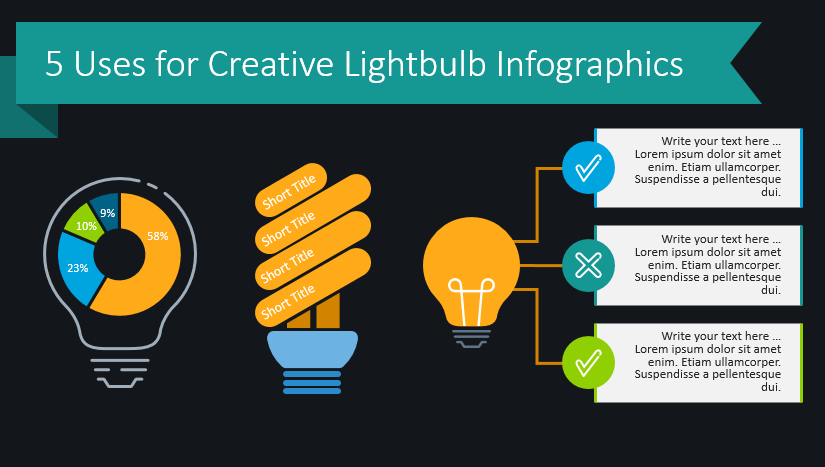
5 Uses for Creative Light Bulb Graphics
Do you need to express your bright ideas, creativity, or innovations in a presentation? If so, lightbulbs may be an appropriate visual metaphor. What creative idea or concept might your audience benefit from? With light bulb graphics, you can highlight new ideas or make lists with greater impact.
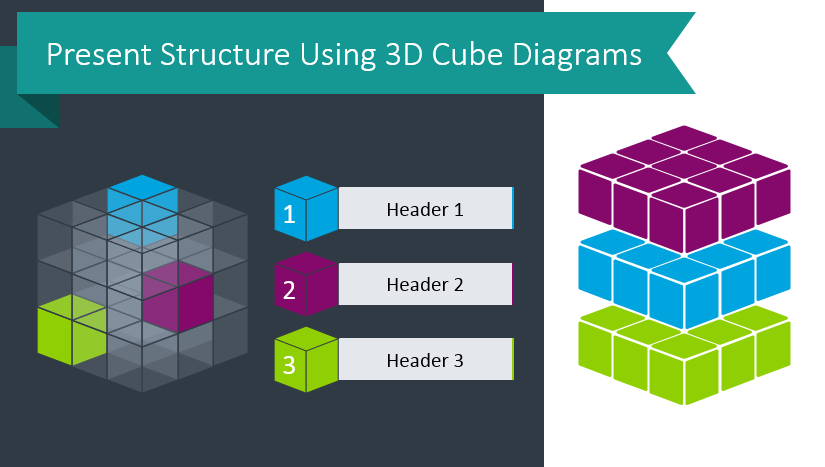
Present Structure Using 3D Cube Diagrams
3D cube graphics are useful visuals. They serve as shorthand for complexity but also order and structure. 3D diagrams can be useful when presenting spatial locations or describing multidimensional relationships.
Continue reading Present Structure Using 3D Cube Diagrams
5 Ways to Use Pipe Shape Diagrams
Do you need to explain a process or flow? Pipe flow diagrams can help. They are great for showing a process timeline, merge several inputs, or turn one input into several outputs. With modern, simple illustrations, you can create memorable, easy to follow presentations.
Read mor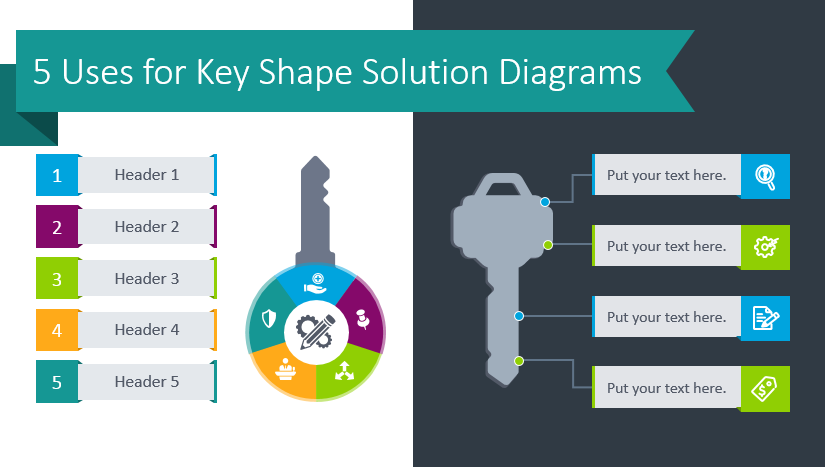
5 Uses for Key Shape Solution Diagrams
What do you think of when you see a key graphic or illustration? Key shape can be a powerful visual metaphor. For many, keys represent solutions to problems or a way to bypass obstacles.
Continue reading 5 Uses for Key Shape Solution Diagrams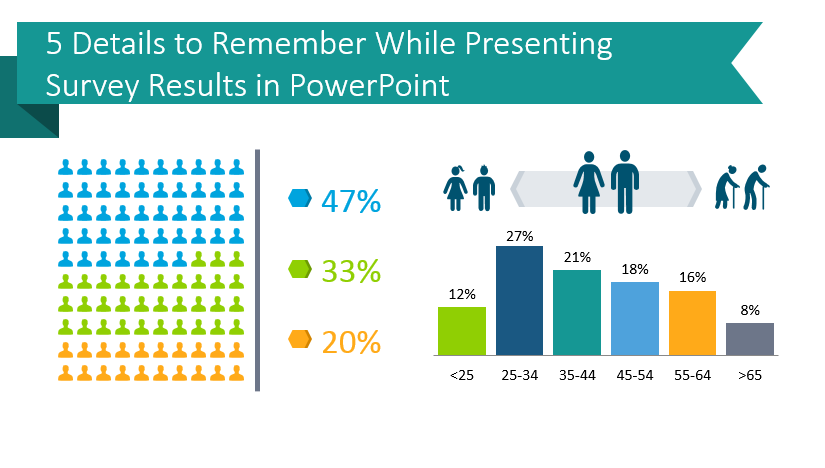
5 Details to Remember While Presenting Survey Results in PowerPoint
Do you need to report survey results? If your next presentation will feature polls, evaluating poll results, or other data analysis consider how you’ll present that information.
Continue reading 5 Details to Remember While Presenting Survey Results in PowerPoint
Use PowerPoint to Make a Stylized Process Flowchart
What is a flowchart? How might a flowchart benefit your presentations?
A flowchart is a diagram you can use to represent an algorithm, workflow, or process.
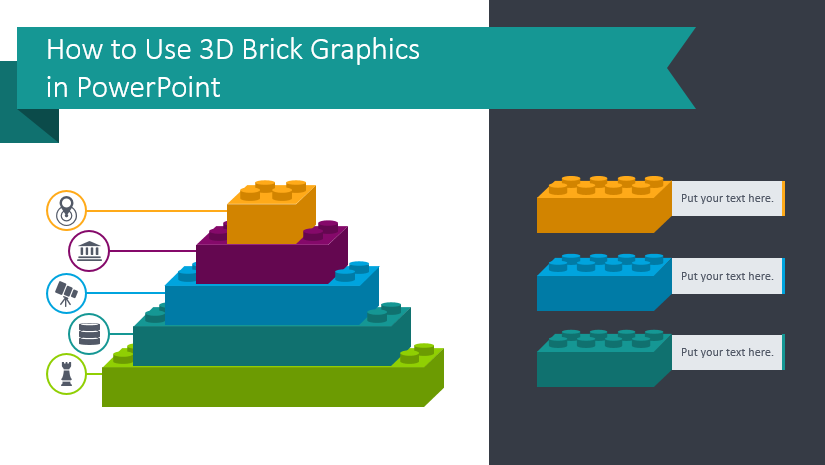
How to Use 3D Brick Graphics in PowerPoint
Would you like to have more fun with your presentations? Incorporate plastic building brick graphics. Plastic toy blocks are popular with children and adults who want to add a playful element to their presentations. Would you like to utilize fun and creativity?
Continue reading How to Use 3D Brick Graphics in PowerPoint
Build Creative Mind Map Diagrams in PowerPoint
Mind Maps are visualization methods. Mind map diagrams are designed to help you develop creative ideas. By using a Mind Map instead of a list, table, or basic-looking SmartArt you can create a visually engaging, interesting slide.
Continue reading Build Creative Mind Map Diagrams in PowerPoint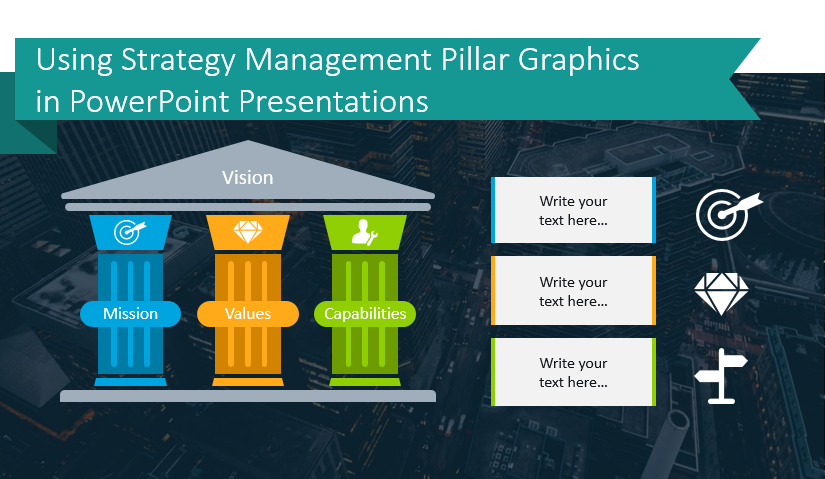
Using Strategy Management Pillar Graphics in PowerPoint Presentations
Ancient pillars are the perfect visual metaphor for the essential values of business strategy. The different pillars of business excellence represent the core values. They form the foundation and support the “roof” – the company vision. See illustration examples on how you can incorporate pillar graphics into your slides.
Continue reading Using Strategy Management Pillar Graphics in PowerPoint Presentations