How to Present Operations, OPEX on a Slide [concept visualization]
Do you need to present an idea of business operations or operational expenditures, so-called OPEX?
Do you need to present an idea of business operations or operational expenditures, so-called OPEX?
Do you want to visualize your strategy’s potential on the slide? In this…

Illustrating goods in a presentation, such as food, animals, plants and other farming…
Today data and digitalization of business operations is everywhere. No matter where you…
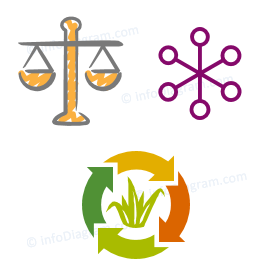
In business, obtaining and maintaining balance is an essential part of the day…
Paving the way toward progress is something every salesperson or marketer worth their…

Do you recall the last presentation you’ve seen about business status? You know,…

One thing our clients struggle with when preparing PowerPoint presentations is how to…
Business development is so often used buzz word, that’s hard to find a…

Sometimes the issue isn’t with making sure your audience stays engaged, it’s keeping…

Updated August 2026. Many of our clients report that July and August are…
Creating a value of some kind is the essence of every business. It…
Do You Have an Engaging Presentation? The worst part of sitting through the…
Over the last months, our designers worked like a hell :). One of the…
A strategy is a common topic I often see in company presentations of…
Besides designing presentation slides, I often see another challenge – how to effectively…
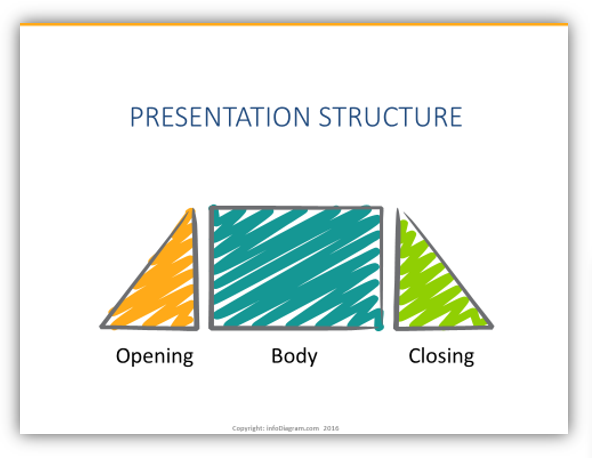
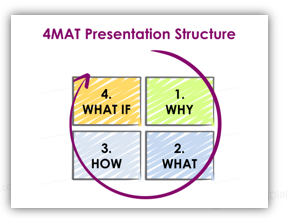
Opening, body, and closing are obvious structure parts of the presentation. However, are…

When presenting to your team or another department, it can be difficult to…
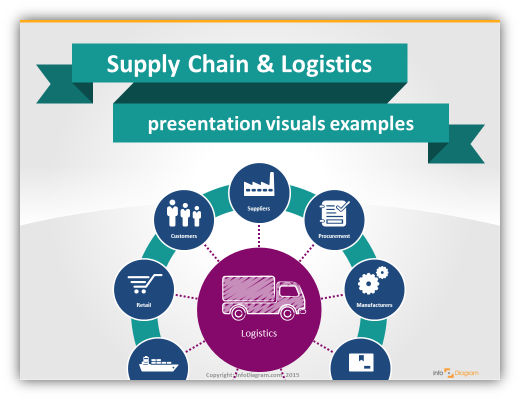
The topic of Supply Chain is pretty complex – with all global or…

Doodling on paper is a great way to get really creative. I recommend…