One Picture to Rule Them All – Concept Visualization List for Better Slides
List of visual metaphors to use to present a business concept in a…
List of visual metaphors to use to present a business concept in a…
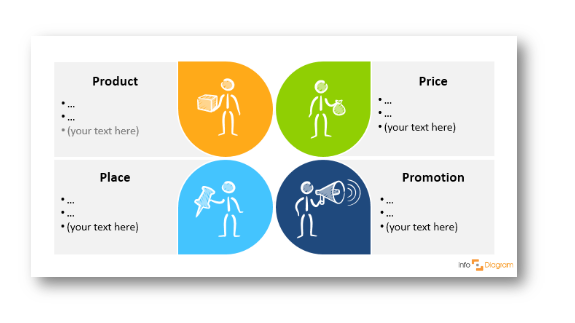
Many of us have heard of the marketing mix and 4P’s, but is…

How even a non-designer can create neat infographics in PowerPoint Today we are…
For a presenter, PowerPoint or other presentation software is indeed the main tool…
If you’re working on market research or just planning the future of your…
‘The very last deadline is February the 29th!’ How often do we hear…

A few tips on how to express visually the idea of flexibility in…
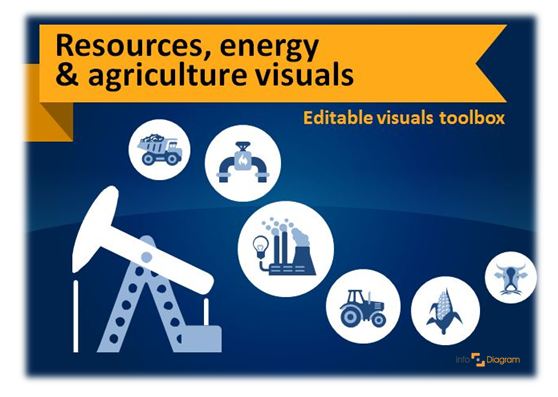
Talking about energy resources or agriculture topics? Illustrating natural and alternative energy operations, or…
In the era of content marketing, everybody is speaking about an importance of a…

Looking for an answer on how to be more creative and original while…
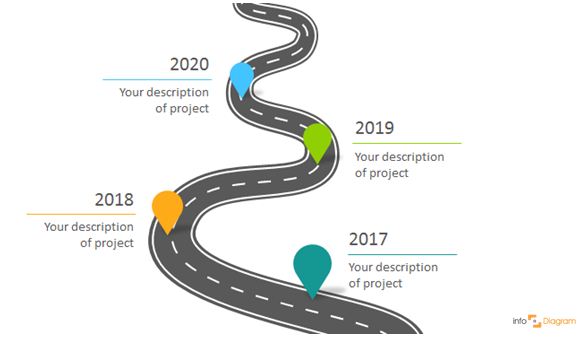
When you want to present long-term plans, visualizing them is the best way…
The Boston Consulting Group’s product portfolio matrix (BCG) is designed to help with…
The concept of knowledge or education appears in various places in presentations. You…
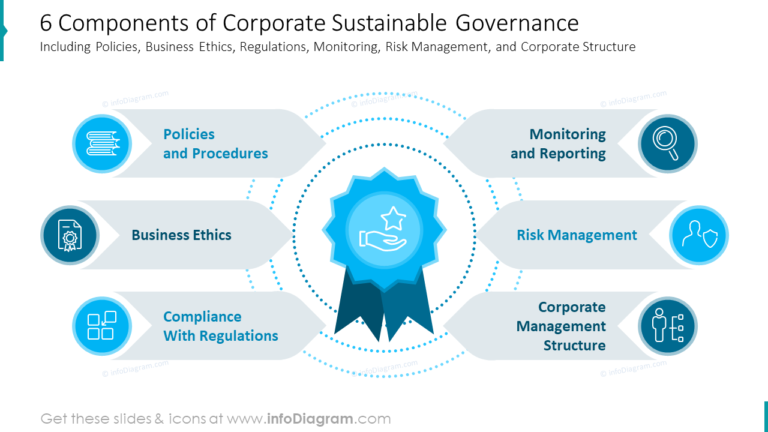
Is a security, safety or stability topic of your speech? Do you need to present…
Need to present risk concept in your next presentation? We see this concept to…
The AIDA Model identifies cognitive stages an individual goes through during the buying…
The PEST analysis is a useful tool for understanding market growth or decline,…
Have no idea how to present an idea of a service? Is a service…
Need to illustrate Investment concept? Is Investment or CAPEX expenses a topic of…